Market Structure: Higher Highs and Lower Lows
Market structure describes how price swings relate to one another. It is one of the simplest ways to separate trend from noise.
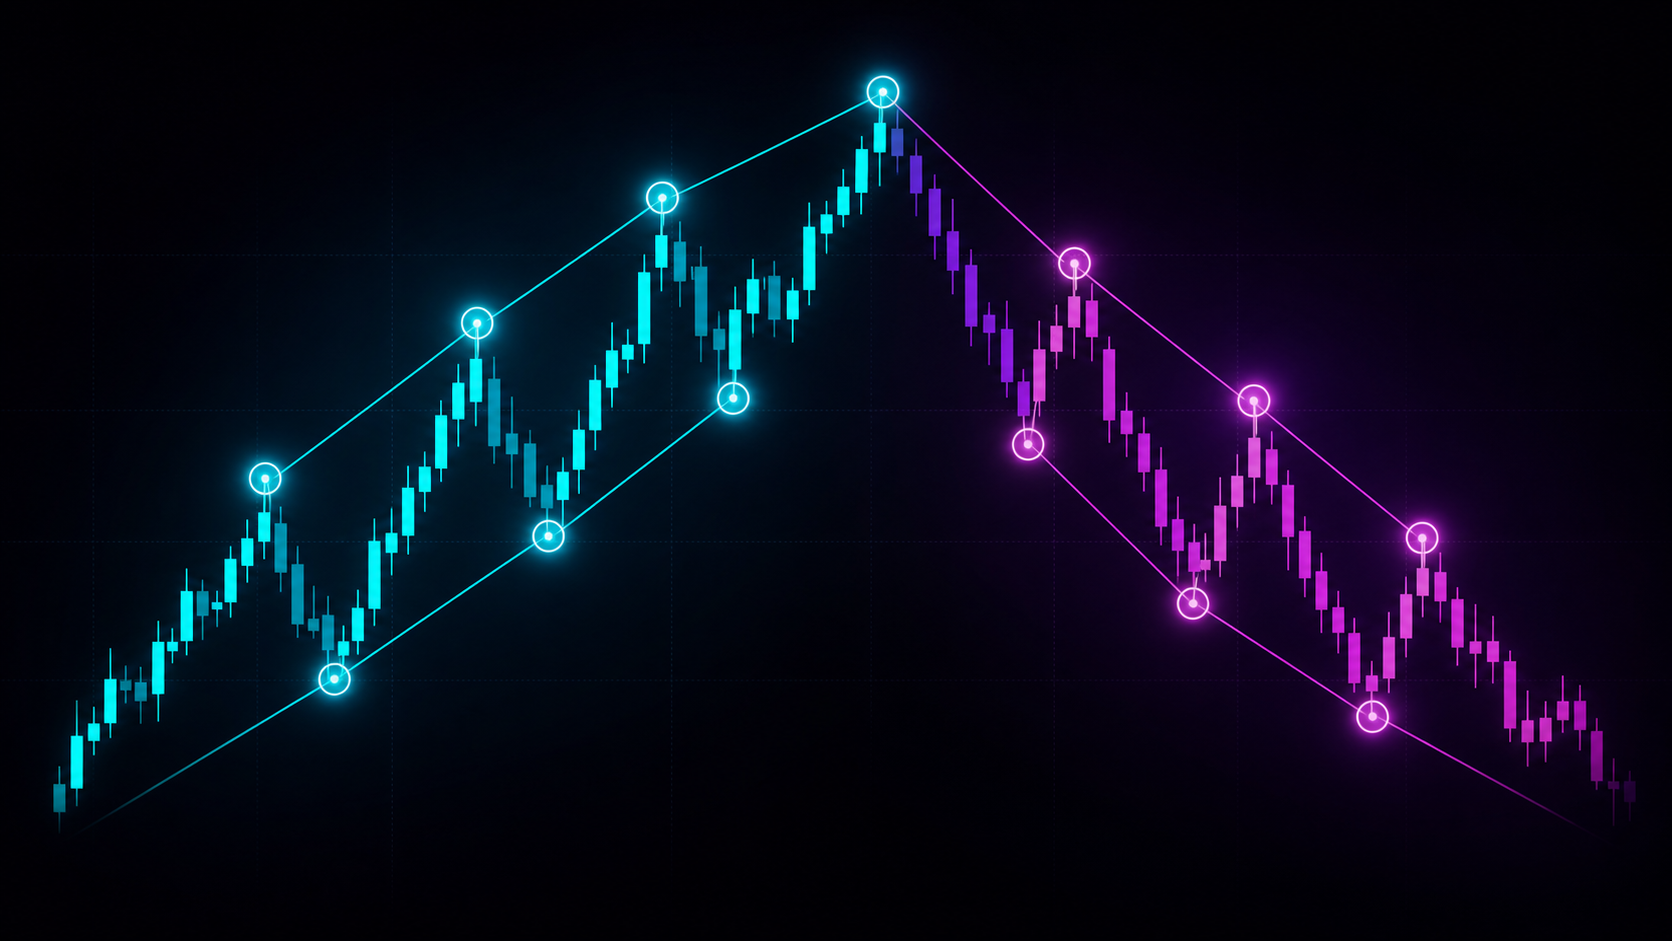
An uptrend generally forms higher highs and higher lows. A downtrend forms lower lows and lower highs. When that sequence stops, the market may be ranging or transitioning.
The chart does not move in a straight line. It pushes, pauses, pulls back, and pushes again. Market structure is the practice of reading those swings instead of reacting to every candle.
In an uptrend, buyers are usually able to push price to new highs and defend higher pullbacks. In a downtrend, sellers are usually able to push price to new lows and defend lower recoveries. In a range, neither side makes clean progress for long.
This is simple in theory and messy in real markets. The skill is deciding which swings actually matter.
Swings Need a Timeframe
Structure is fractal. A five-minute chart can show a small downtrend inside a four-hour uptrend. A tiny swing can break without changing the larger story.
Before drawing conclusions, define the timeframe you are using for context and the timeframe you are using for execution. If every candle becomes a swing, the analysis is too sensitive. If you ignore all smaller movement, entries may become too late.
Multi-Timeframe Analysis helps connect these layers.
Bullish and Bearish Structure
Bullish structure usually develops when price pushes to a higher high, pulls back, holds above the previous major low, and advances again. The higher low shows that buyers accepted a higher area of value. The higher high shows continued progress.
Bearish structure reverses the idea. Price makes a lower low, recovers, fails below the previous major high, and declines again. The lower high shows that sellers acted before price could fully recover.
The important point is not the label. The important point is whether one side is making progress.
Structure Breaks Need Context
A break of one swing does not automatically create a new trend.
Ask whether the broken swing was structurally important, whether price closed beyond it or only wicked through, whether momentum expanded, whether price is breaking directly into support or resistance, and whether the higher timeframe agrees.
A structural break is evidence. Confirmation comes from what price does next.
How Traders Use Structure
Structure can define trend direction, pullback areas, invalidation, possible reversal evidence, and logical targets near previous extremes. It helps a trader say, "If price breaks this level, my idea is wrong."
That makes structure directly connected to stop placement and planning entry, stop, and targets.
Using ZenAlgo
Avenger helps organize structure and trend context. Haze provides another directional perspective. Use these tools to make structure easier to read, not to avoid defining invalidation.
Continue Learning
- Learn support and resistance.
- Distinguish pullbacks from reversals.
- Study how to identify a market trend.
Market structure is subjective and can change quickly. Always define risk before acting on a structural interpretation.