How Candlesticks Work
Candlesticks compress price activity into a visual format. Each candle summarizes what happened during one chosen period.
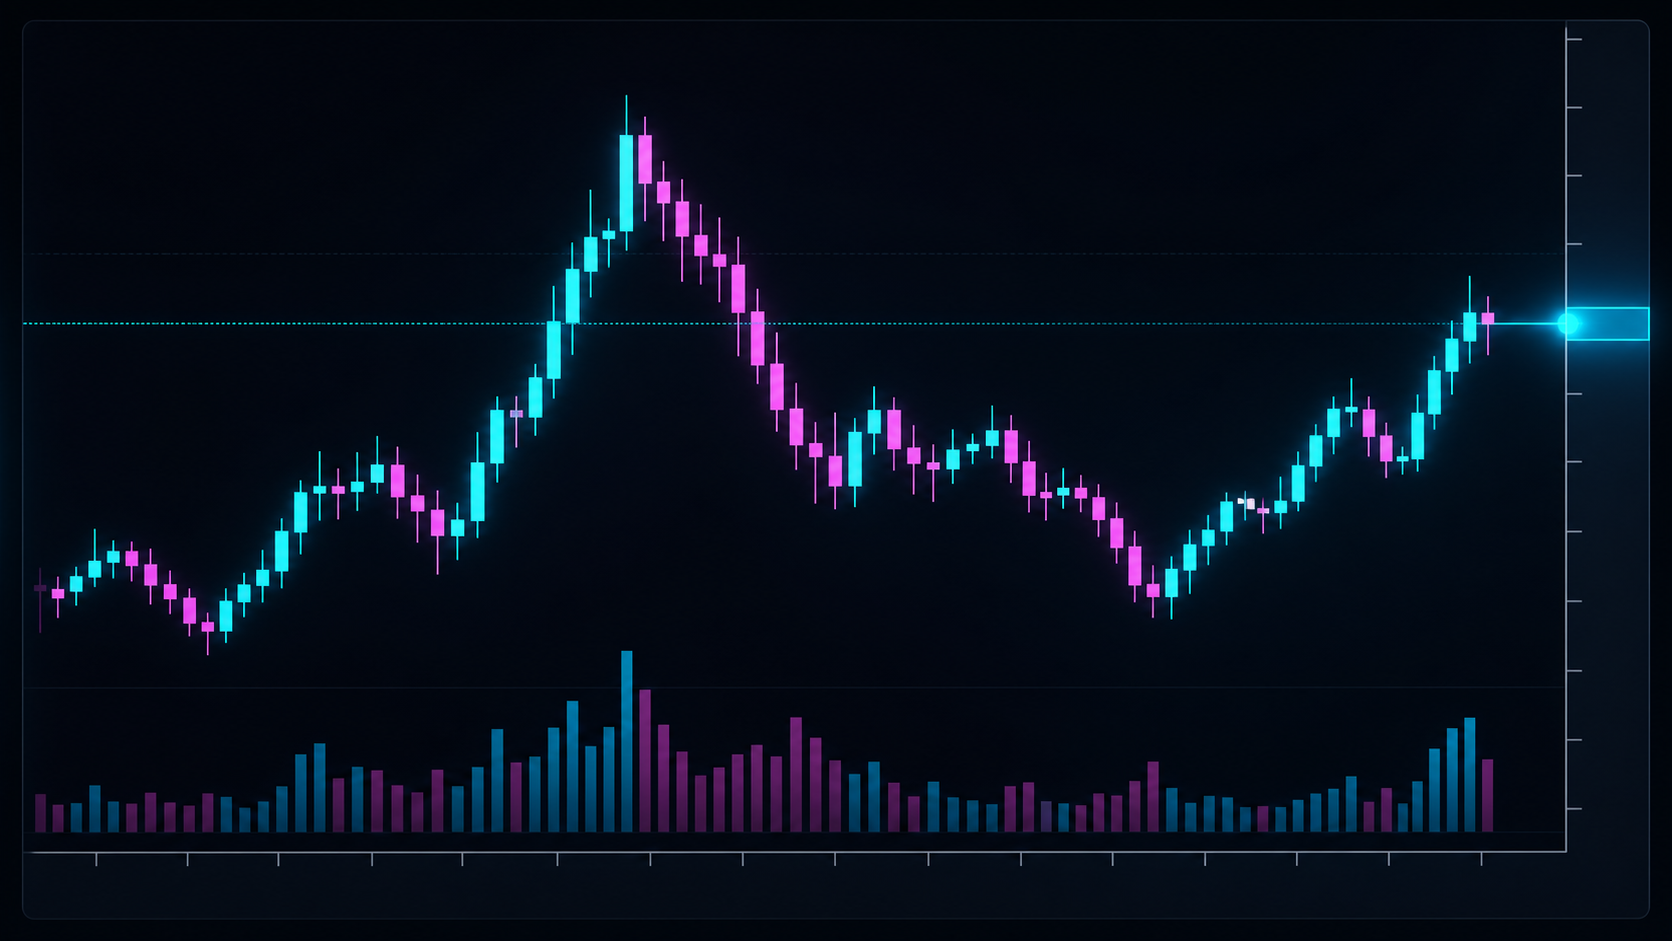
A candle shows the open, high, low, and close for one period. Its meaning depends on where it forms and what happens around it, not only on its shape.
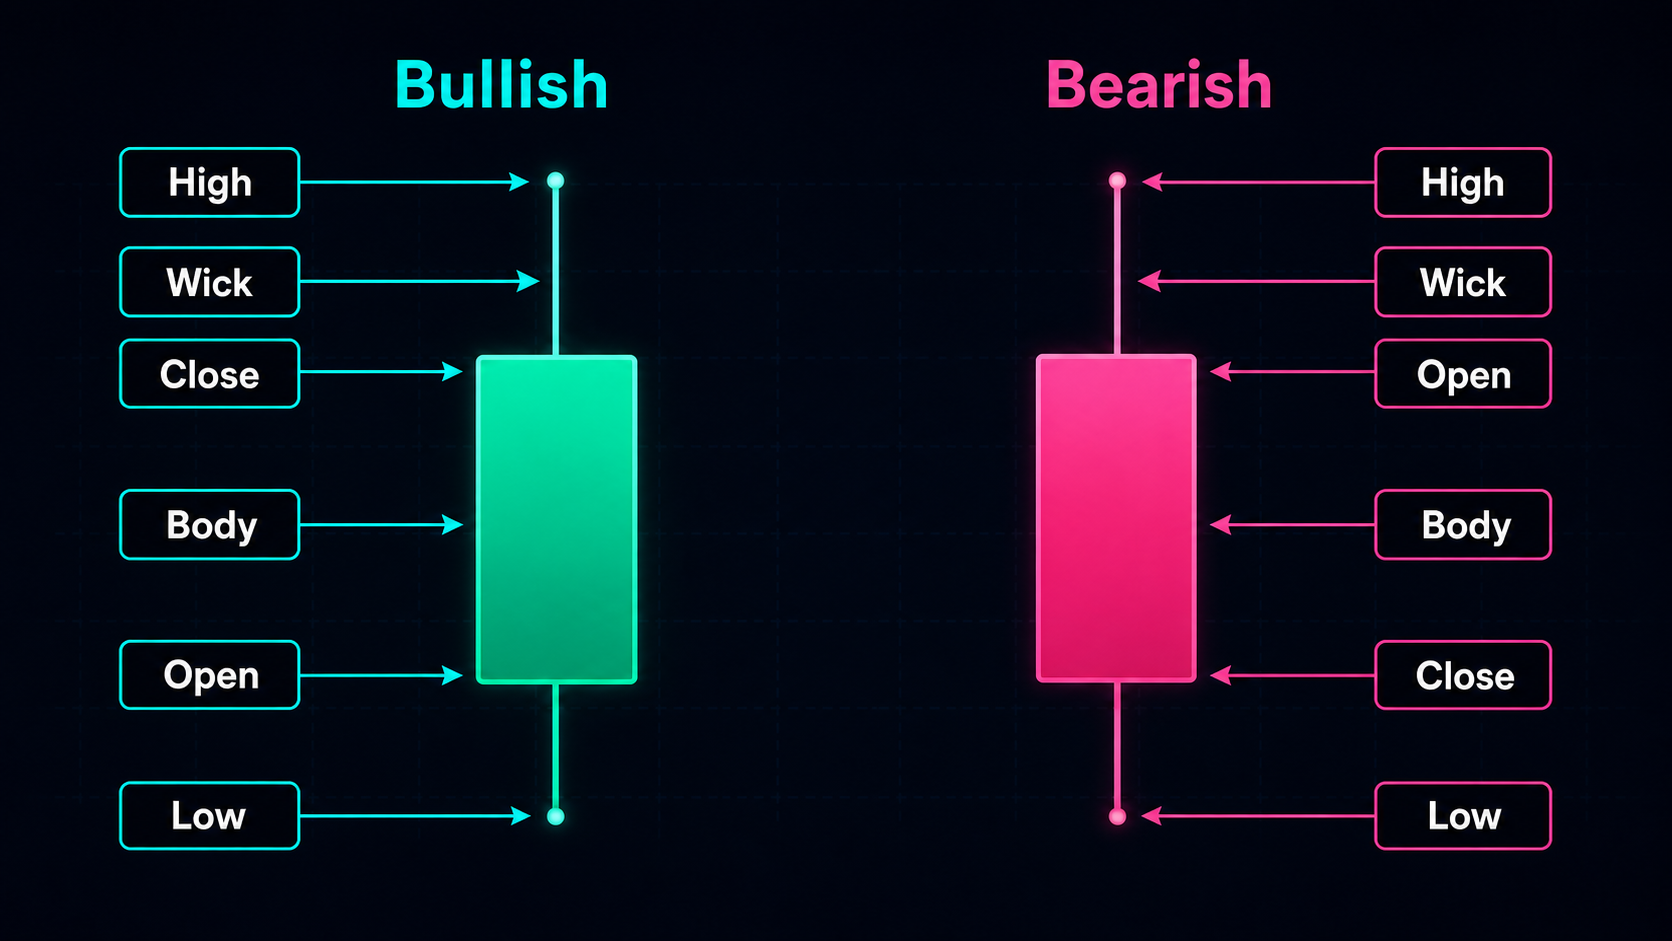
Candle Anatomy
Every traditional candle contains four prices:
- Open: the first traded price in the period.
- High: the highest traded price.
- Low: the lowest traded price.
- Close: the final traded price.
The body connects open and close. The wicks show movement beyond the body.
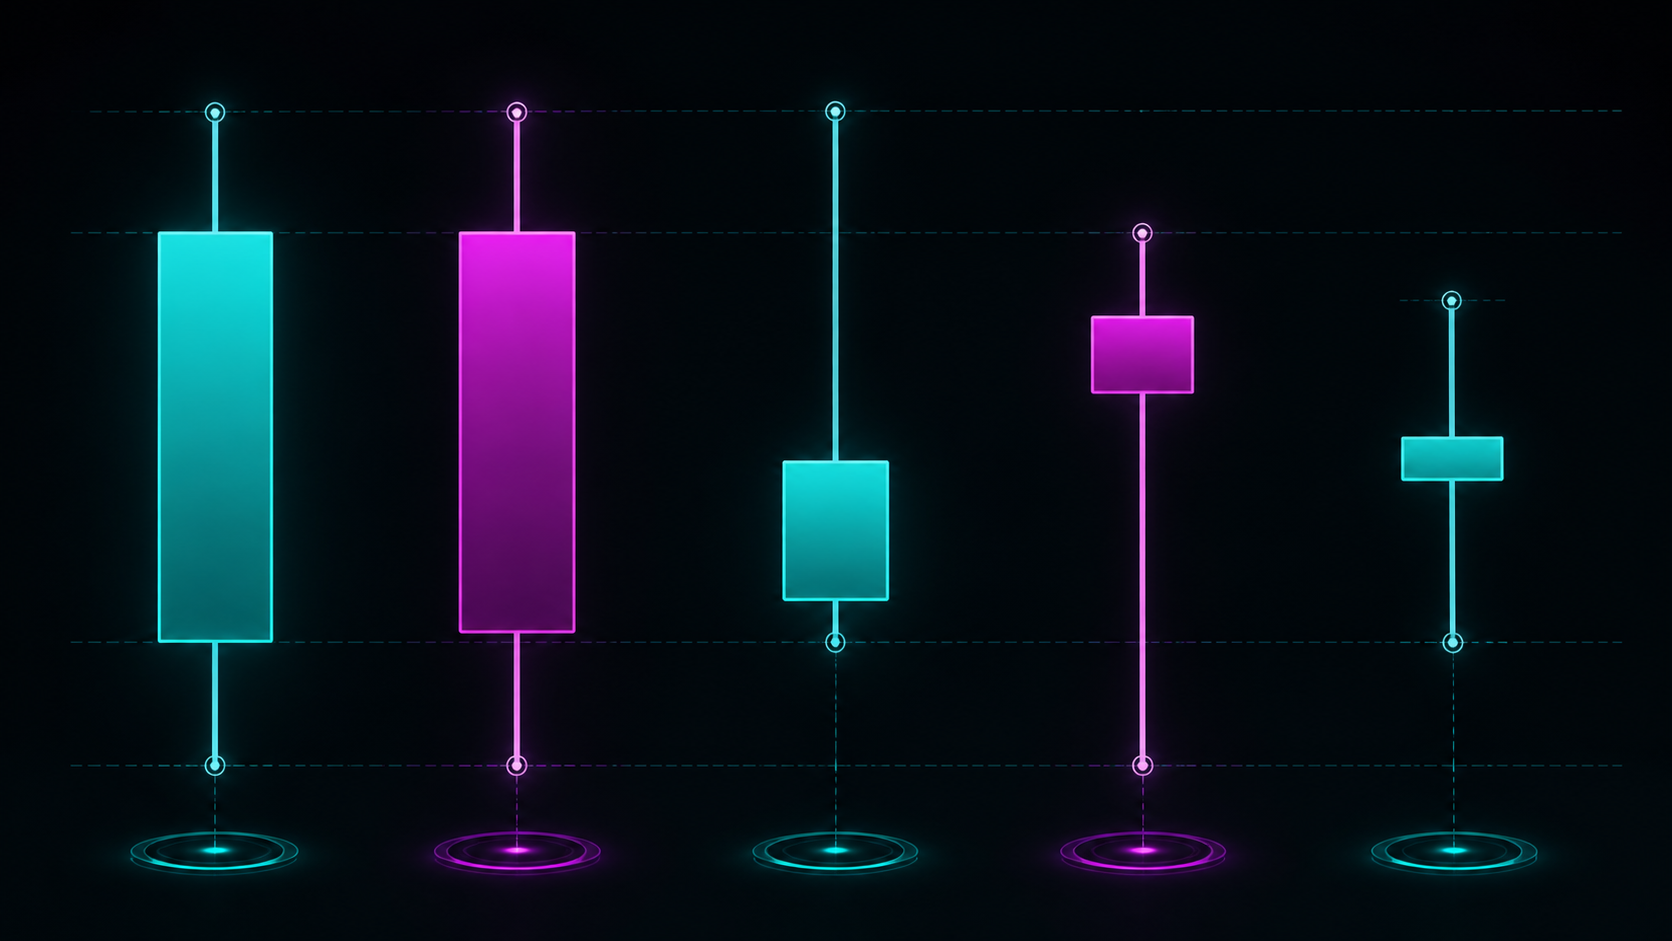
| Candle feature | Useful interpretation |
|---|---|
| Large body | Strong net movement during the period |
| Small body | Limited progress or temporary balance |
| Long upper wick | Price traded higher but did not hold |
| Long lower wick | Price traded lower but did not hold |
| Close near the high | Buyers retained control into the close |
| Close near the low | Sellers retained control into the close |
These are observations, not automatic signals.
Bullish and Bearish Candles
A traditional bullish candle closes above its open. A bearish candle closes below its open.
That does not mean a bullish candle contains only buying or a bearish candle only selling. Every completed trade has both sides. Candle direction simply shows where the period closed relative to where it opened.
Timeframe Changes Meaning
A one-hour candle summarizes twelve five-minute candles. A daily candle contains all activity from its trading day.
The same wick may look significant on a five-minute chart but insignificant inside a weekly range. Always interpret candles within the timeframe used for your decision.
Location Comes Before Pattern
A long lower wick can mean very different things:
- at established support, it may show rejection;
- in the middle of a range, it may be ordinary noise;
- after an extended decline, it may signal exhaustion;
- during a strong breakdown, it may only be a pause.
Before naming a candle pattern, ask:
- Where did it form?
- What structure preceded it?
- Did volume or momentum change?
- Did the next candles confirm the reaction?
Candle Sequences Matter More
Professional chart reading rarely depends on one candle.
A sequence of strong bodies closing near their highs tells a clearer story than one isolated bullish candle. Alternating small candles with long wicks often suggest balance, hesitation, or low-quality conditions.
Heavy Delta PVSRA Candles add volume context to candle behavior. Ultimate combines several forms of context into a broader view.
What Candles Cannot Tell You Alone
Candles do not reveal:
- who initiated every trade;
- whether a move will continue;
- where every participant is positioned;
- whether a wick was caused by thin liquidity;
- whether the setup offers acceptable risk.
For pressure and participation context, combine price with tools such as Delta or Advanced Open Interest, when appropriate to the market.
A Practical Reading Method
Read candles in three layers:
- Structure: trend, range, breakout, or transition.
- Location: support, resistance, value, or open space.
- Behavior: bodies, wicks, closes, and follow-through.
This prevents attractive candle shapes from overriding the larger context.
Key Takeaways
- Traditional candles show actual open, high, low, and close.
- Body size shows net progress; wicks show rejected or revisited prices.
- Candle meaning changes with timeframe and location.
- Sequences and follow-through matter more than isolated patterns.
- Candles provide evidence, not certainty.
Continue Learning
- Learn how Heikin Ashi candles smooth price action.
- Compare Heikin Ashi and traditional candles.
- Study support and resistance.
Candlestick patterns can fail and should never replace position sizing, invalidation, and risk management.