Heavy Delta - PVSRA Candles
PVSRA Candlestick Coloring compares price movement, candle spread, and volume. Its purpose is to make unusually active candles easy to notice without opening a separate volume panel.
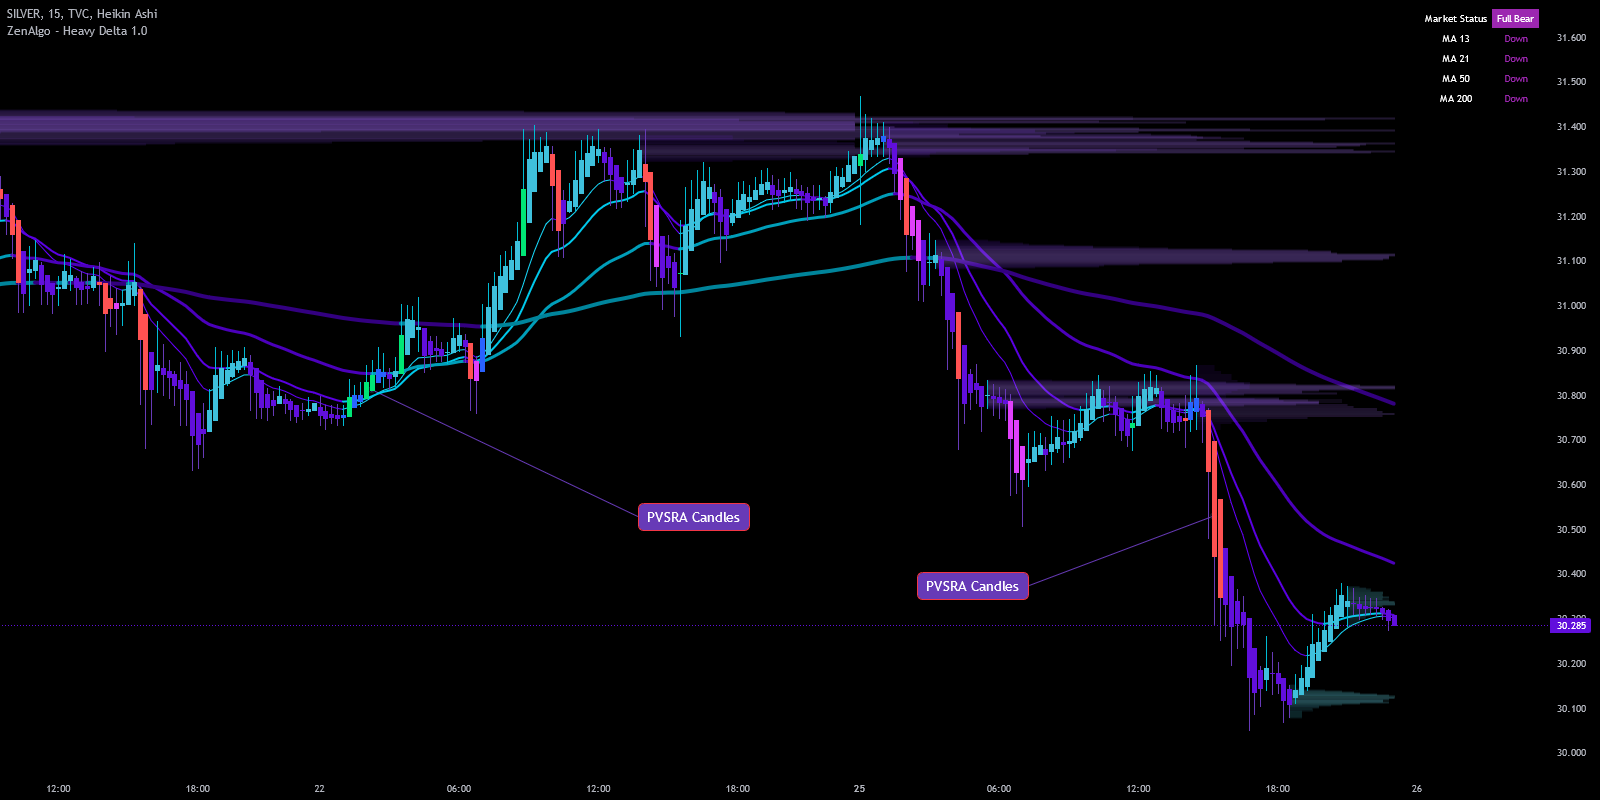
PVSRA cannot reveal who traded or why. It shows where volume and price spread differ from recent behavior, which can help you investigate possible accumulation, distribution, breakout activity, or exhaustion.
Read an unusual PVSRA candle in its price context. High activity at a range boundary means something different from high activity in the middle of a range.
Key elements of PVSRA
| Key Element | Description |
|---|---|
| Price | Analyzing how price behaves at critical levels, such as support or resistance, helps determine the possible direction of the next move. Sudden spikes or drops in price are often telling of institutional activity. |
| Volume | Volume is a crucial indicator for gauging the strength of a price move. PVSRA emphasizes volume as a key component, examining whether high volume occurs during a move up or down, which may indicate buying or selling pressure from institutions. |
| Support and Resistance | PVSRA takes into account important price levels where the market has historically had trouble moving past. The interaction between price and these levels, combined with volume analysis, helps identify accumulation or distribution areas. |
Visual representations
In ZenAlgo, the PVSRA Candlestick Coloring visually differentiates the sentiment behind each candle:
| Candle Type | Description |
|---|---|
| Bullish Candles | Often colored to indicate high buying interest, typically represented by higher volume on upward moves, suggesting strong institutional buying at certain price points. |
| Bearish Candles | Marked to highlight heavy selling pressure, often coupled with high volume, implying that institutions might be offloading positions. |
| Neutral or Key Levels | When price consolidates or approaches significant support/resistance with notable volume, the color coding helps indicate potential reversals or breakouts. |
The coloring system is a visual filter for unusual activity. After a highlighted candle appears, watch the next candles to see whether price follows through or rejects the move.
When interpreting PVSRA candles, remember that color alone is not a guarantee of direction. Consider other indicators and analysis to confirm potential moves.
Configuration

Customize the PVSRA settings in ZenAlgo to align with your trading style. For example, adjust color settings to make high-volume bearish candles more prominent if you're focusing on spotting selling pressure.