Heavy Delta - Moving Averages (MA)
Heavy Delta includes four customizable moving averages. Together they show how short-, medium-, and longer-term price direction relate to one another.
Moving averages are lagging indicators, reflecting past trends based on historical data rather than predicting future movements.
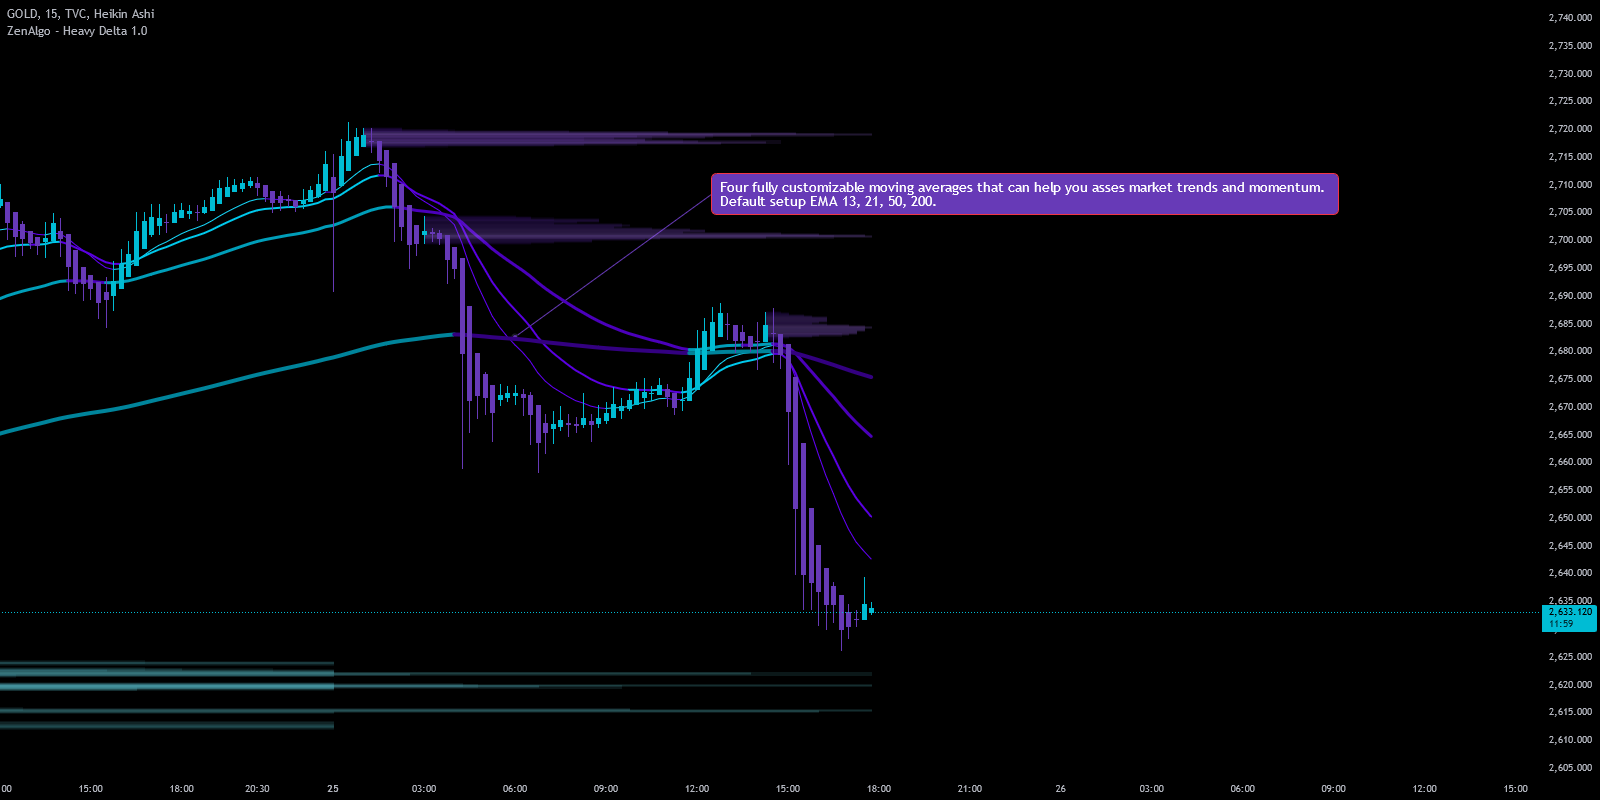
ZenAlgo Moving Averages Types
ZenAlgo offers various types of MAs suited for different strategies:
| Moving Average Type | Key Feature |
|---|---|
| EMA (Exponential MA) | Responsive to recent data |
| SMA (Simple MA) | General trend without fluctuation |
| WMA (Weighted MA) | Linear weighting on recent prices |
| HMA (Hull MA) | Reduced lag for quicker trends |
| VWMA (Volume Weighted MA) | Volume influences price weighting |
| RMA (Running MA) | Rolling average, similar to EMA |
Each moving average type can be adjusted for length to suit specific timeframes (e.g., 13, 21, 50, 200). This flexibility means you can customize each MA for short- or long-term strategies. ZenAlgo indicators also offer dynamic color changes to help visualize trend direction:
- Bullish: Price above the MA with a designated color for upward momentum.
- Bearish: Price below the MA with a contrasting color for downward momentum.
Configuration
ZenAlgo's MAs are tailored to match diverse trading styles, providing valuable insights at a glance.

Market Status Table Overview
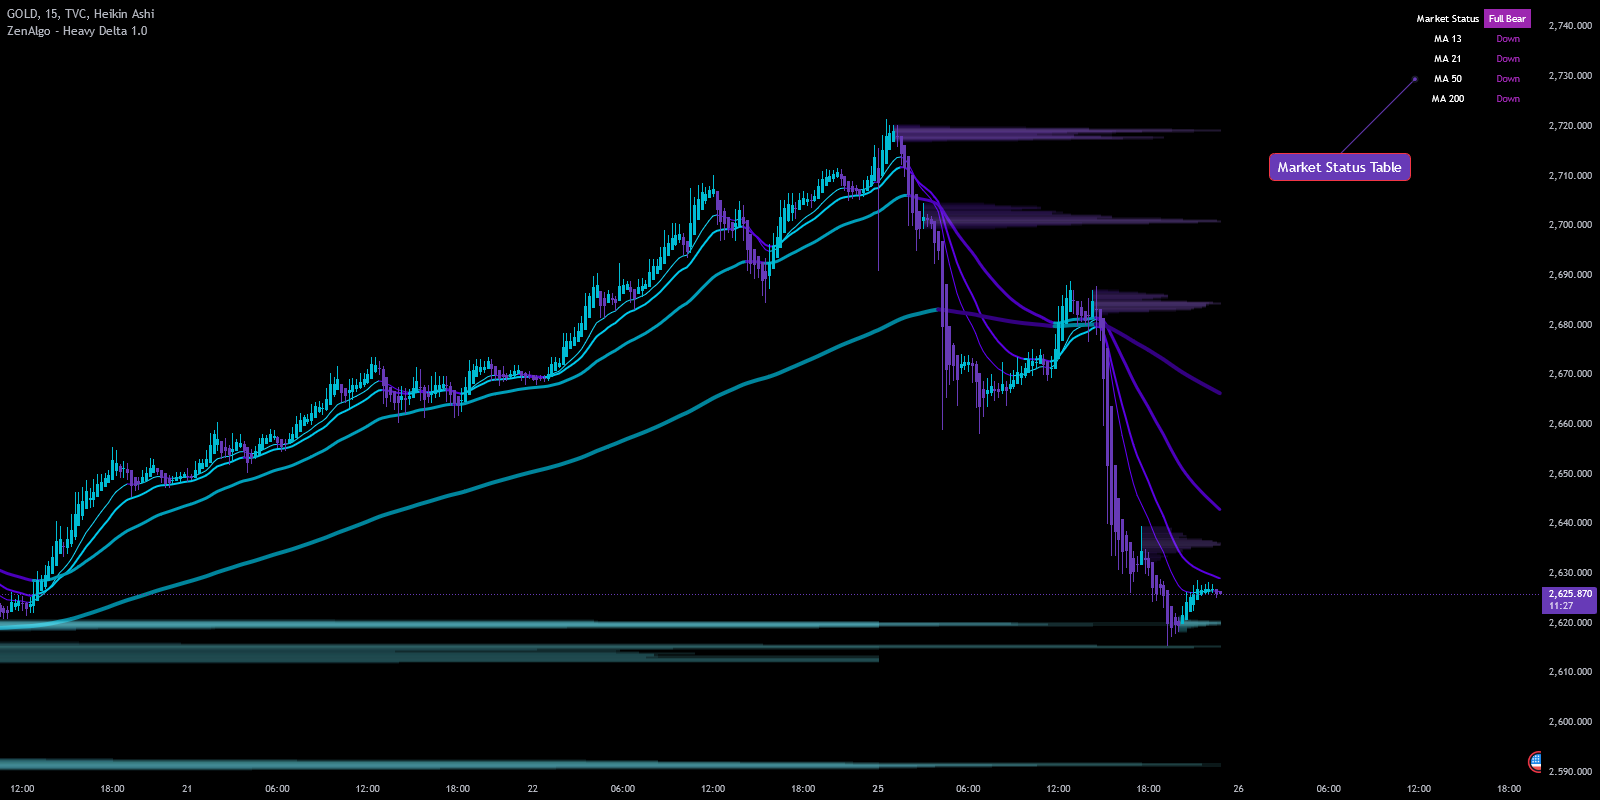
The Market Status Table summarizes the moving-average relationship so that you do not have to inspect every line separately.
Market Status Levels
The table shows whether price is above or below the key averages and turns that relationship into a broad state:
- MA Comparison: The table includes key moving averages—typically
MA 13,MA 21,MA 50, andMA 200. It shows whether the price is currently positioned above or below each of these MAs, with clear labels such as "Up" or "Down". The color coding makes it intuitive: green signifies price above (bullish), while red indicates price below (bearish). - Market Status Levels:
| Market Status | Description |
|---|---|
| Neutral | When price is above two MAs, indicating potential without a strong trend. It may signal a reversal or awaiting momentum. |
| Bullish | When price is above three MAs, suggesting early buying pressure and a potential uptrend. |
| Full Bull | When price is above all four MAs, indicating a strong bullish trend across all timeframes. Long positions may be more favorable. |
| Bearish | If the price is below three MAs, showing downward momentum. |
| Full Bear | Price below all four MAs signals a strong downtrend, emphasizing bearish sentiment. |
The state is a summary, not a signal. A Full Bull state after a long expansion can describe strength while price is already stretched; always combine the table with location and the slope of the averages.