Heavy Delta - VWAP Indicator
Volume-Weighted Average Price (VWAP) is an average price weighted by traded volume. Unlike a simple moving average, periods with more activity have more influence on the line.
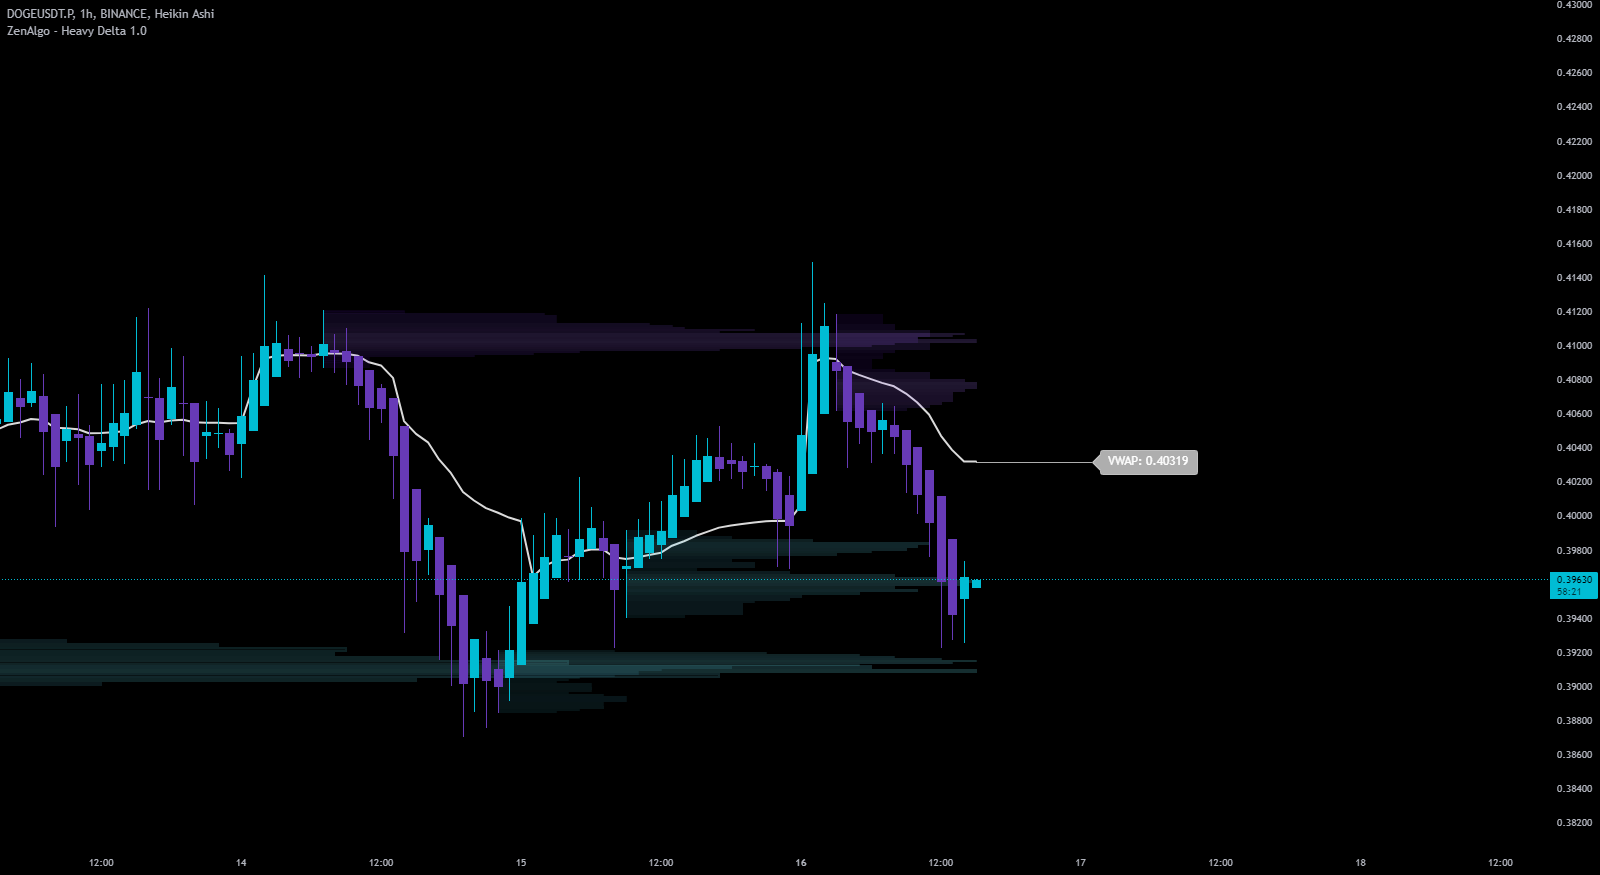
How It Works in the Code
Calculating the VWAP
The script requests price and volume data, feeding it into a built-in VWAP calculation function. The calculation resets at a chosen anchor period, such as the start of the session, week, month, quarter, or year, depending on the selected input.
For example:
- Use Session VWAP for intraday trading.
- Opt for Monthly VWAP for longer-term analysis.
Plotting the VWAP Line
Once calculated, the VWAP line is drawn dynamically on the chart as new price and volume data become available. The code includes options to toggle the VWAP line and its label, which shows the current VWAP value on the right side of the chart. This ensures flexibility and clarity for traders.
Why is it Useful?
Market Benchmark
VWAP serves as a fair-value benchmark, helping traders gauge market sentiment:
- 📈 Price above VWAP: Indicates a stronger, bullish session.
- 📉 Price below VWAP: Suggests a weaker, bearish session.
🏦 Pro Insight: Institutional traders often compare their trade executions to VWAP to ensure they're getting a "better-than-average" price.
Support and Resistance
VWAP acts as a dynamic support or resistance level:
- Approaching VWAP from above: 🚀 Potential support zone.
- Approaching VWAP from below: ⚠️ Possible resistance.
Intraday Trading Tool
Intraday traders often rely on VWAP for precision:
- 💵 Buying below VWAP: Indicates a potential "discounted" entry.
- 💰 Selling above VWAP: Suggests a "premium" exit.
Customizations and Uses
Anchor Periods
⏳ Choose from various anchor periods (Session, Week, Month, Quarter, or Year) to match your trading strategy and timeframe.
Visibility and Labeling
📌 Toggle the VWAP line and its label for a clutter-free chart. The label shows the current VWAP value, making it easy to compare against the market price.
Combining with Other Indicators
VWAP becomes easier to interpret when paired with other references:
- Overlay moving averages to confirm trends.
- Use daily open levels to assess intraday sentiment.
- Combine with Monday ranges for weekly context.
If the price holds above both the daily open and VWAP, it reinforces a bullish intraday trend.
In Summary
VWAP provides a volume-weighted value reference. Price above or below it describes location; distance and the reaction around the line help explain whether the market is accepting that location.