Heavy Delta - Delta Symbols
Delta in trading measures the difference between buying volume and selling volume over a specific timeframe, indicating whether buyers or sellers were more aggressive during that period.
- Positive Delta: More buying volume than selling, suggesting bullish sentiment.
- Negative Delta: More selling volume than buying, hinting at bearish sentiment.
Delta adds participation context to price. The most interesting readings often occur when candle direction and delta disagree.
Use delta to ask whether participation supports the candle direction. Agreement confirms the current move; disagreement is a reason to investigate possible absorption or exhaustion.
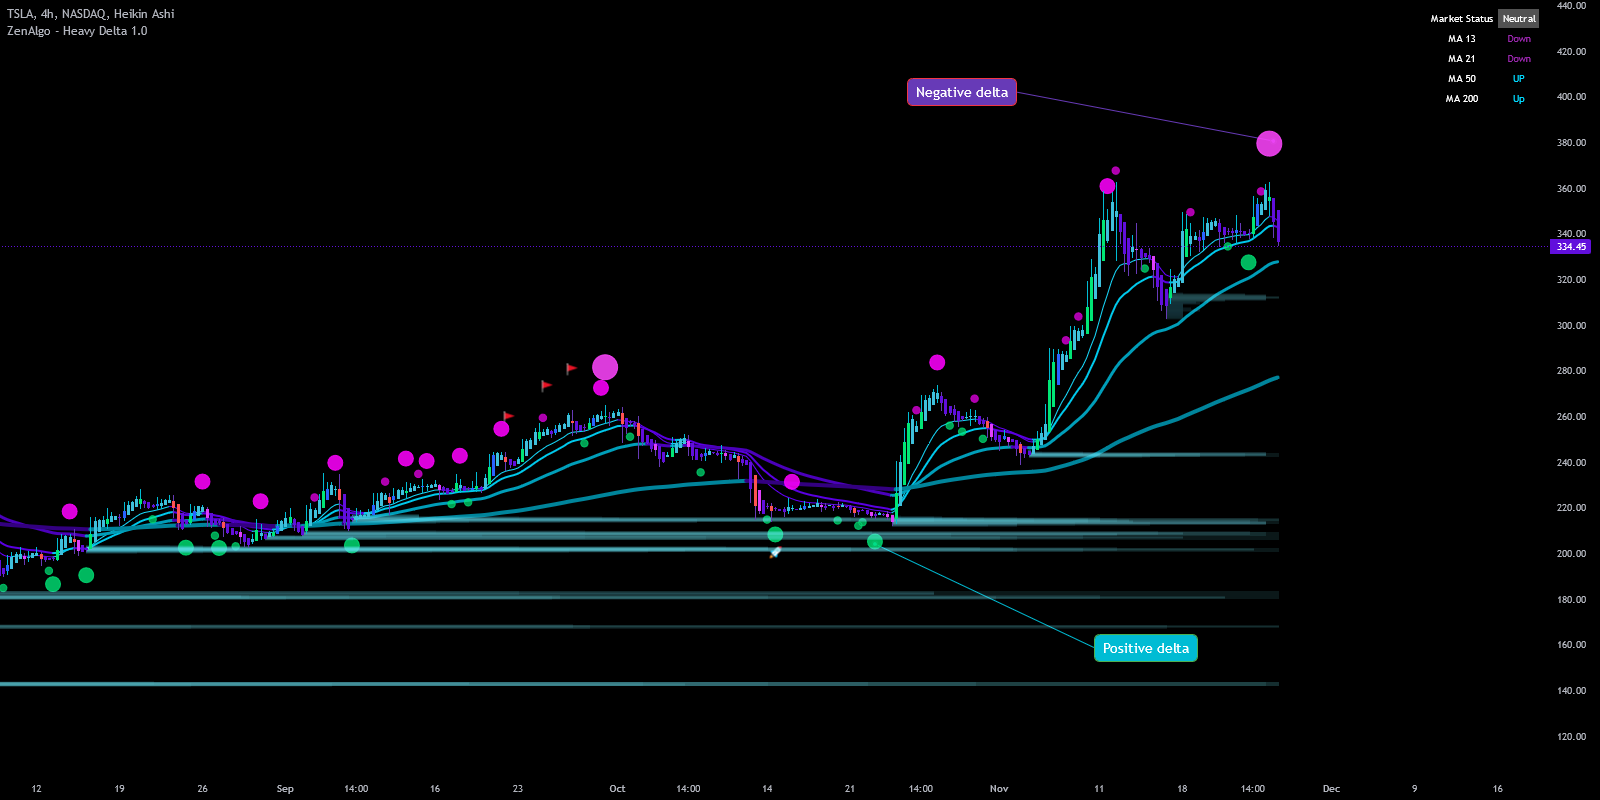
How Delta Works in ZenAlgo
ZenAlgo uses Delta to help visualize and analyze the balance between buying and selling pressure. Here's how it functions:
1. Delta Calculation
ZenAlgo calculates Delta by determining the difference between buying volume and selling volume for each bar.
- Higher Close: If the current bar closes higher than the previous one, the difference between volumes is counted as buying volume.
- Lower Close: If the current bar closes lower, the difference is counted as selling volume.
2. Delta Visualization with Colored Symbols
- Delta values are displayed visually using colored dots above or below candlesticks, providing a quick grasp of market sentiment:
- Yellow Dots: Represent positive Delta (buying pressure) below the price bar.
- Red Dots: Represent negative Delta (selling pressure) above the price bar.
3. Delta Dot Sizes
Delta dots change in size depending on the magnitude of Delta compared to the average Delta over the last 10 bars, offering a visual cue for the strength of buying or selling activity:
| Dot Size | Description |
|---|---|
| Tiny Dot | Current Delta is close to the average, indicating normal buying/selling pressure. |
| Small Dot | Delta is above average, showing increased buying/selling pressure. |
| Normal Dot | Delta is significantly above average, signaling stronger activity. |
| Large Dot | Exceptionally high Delta, suggesting intense buying or selling pressure, often indicating institutional moves. |
4. Why Dot Sizes Matter
The dynamic sizing of Delta dots allows traders to gauge the significance of current market activity compared to recent behavior:
- Large Yellow Dots: Indicate strong buying pressure, suggesting potential upward momentum.
- Large Red Dots: Show strong selling pressure, possibly signaling downward momentum or a trend reversal.
When large Delta dots appear, they may signal institutional interest or significant retail activity. Pay close attention to these dots for potential high-momentum moves.
5. Average Delta Reference
ZenAlgo calculates an average Delta over the last 10 candles, using it as a reference to evaluate current buying or selling strength. If the current Delta exceeds this average by a multiplier, the dot size changes accordingly, helping you distinguish typical market fluctuations from heightened activity.
6. Use Cases of Delta in ZenAlgo
Delta can be applied in various ways to improve trading decisions:
- Trend Confirmation: Positive Delta (yellow dots below bars) that consistently increases can confirm an upward trend.
- Reversal Signals: If price is rising but Delta weakens or flips negative (red dots appear), it may suggest weakening momentum, hinting at a possible reversal.
- Market Imbalance Identification: Large red dots after a price rally may signal profit-taking or resistance, while large yellow dots near support levels can suggest accumulation.
Read Delta dots alongside price structure, volume, and moving averages. A large bullish dot near support is more meaningful than the same dot in the middle of a range.
Configuration
ZenAlgo allows for the customization of Delta symbols for a tailored trading experience.

Summary
The dots translate opposing delta into an easy visual scale. Their direction shows the disagreement; their size shows how unusual it is relative to the configured average.