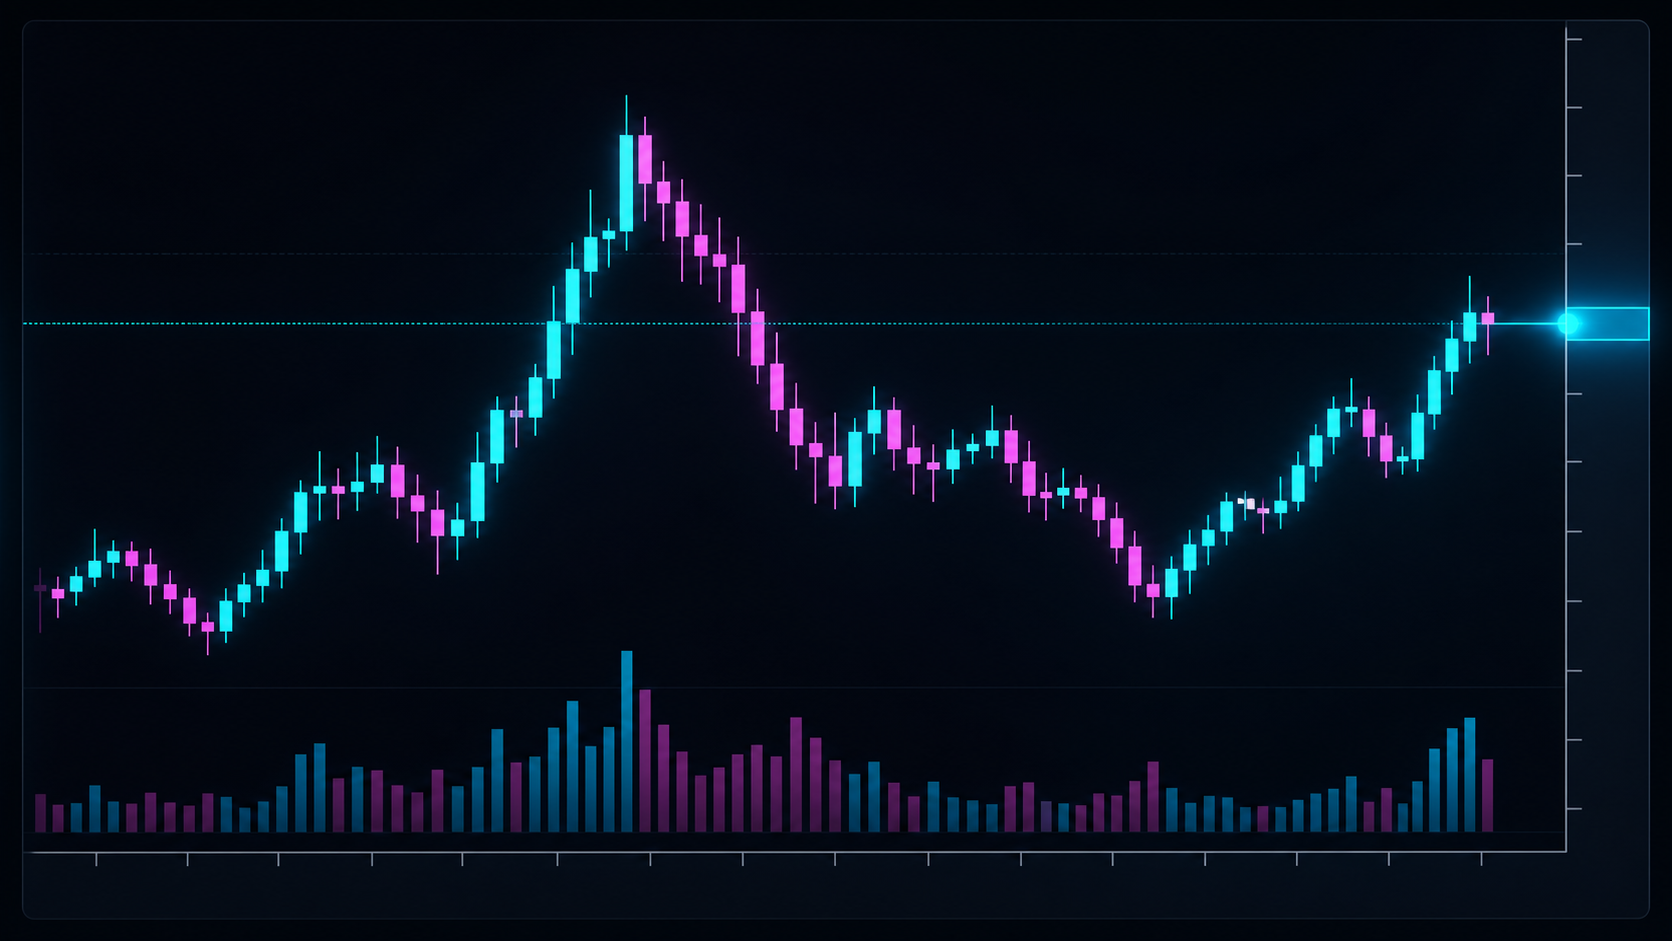
Charts and Price Action
A chart is not a prediction machine. It is a compressed record of where price traded, how quickly it moved, and how buyers and sellers reacted around important areas.
This section teaches you to read that record from the ground up.
Read these articles in order. Each lesson adds one layer of context without requiring a crowded chart.
Build Your Chart-Reading Foundation
- How to Read a Trading Chart
- How Candlesticks Work
- Heikin Ashi Candles Explained
- Heikin Ashi vs Traditional Candles
- Why ZenAlgo Uses Heikin Ashi for Market Context
- Trading Timeframes Explained
Learn to Read Price Action
- Market Structure: Higher Highs and Lower Lows
- Support and Resistance Explained
- Breakouts, Retests, and Failed Breakouts
- Pullbacks vs Reversals
- Range Trading Explained
- Trend Trading Explained
What You Should Be Able to Do Afterwards
After completing this section, you should be able to:
- identify the instrument, price axis, time axis, candles, and volume;
- explain what a candle does and does not reveal;
- choose between traditional and Heikin Ashi candles for a specific task;
- align context and execution timeframes;
- describe bullish, bearish, and neutral market structure;
- mark support and resistance as zones rather than perfect lines;
- distinguish a breakout from a failed breakout;
- separate a routine pullback from evidence of a reversal;
- recognize when conditions favor range or trend tactics.
A Useful Reading Order on Any Chart
Ask these questions before looking for an entry:
- What instrument and timeframe am I viewing?
- Is price trending, ranging, or transitioning?
- Where are the important reaction zones?
- Is price approaching, rejecting, or breaking a zone?
- Does the setup fit the current condition?
- Where is the idea invalidated?
This sequence turns chart reading into a repeatable process instead of a search for patterns.
Practice With ZenAlgo
Use the seven-day trial to compare raw price action with structured ZenAlgo context. Begin with Avenger for trend and structure, then add only the tools that answer a specific question.
After you can read a chart, connect that skill to execution: learn Markets, Orders, and Leverage, then Risk Management, and later practice the top-down chart analysis workflow.
Chart reading is interpretive and cannot guarantee future outcomes. This material is educational only and is not financial advice.