Heikin Ashi Candles Explained
Heikin Ashi candles transform ordinary price data into a smoother visual representation of direction and momentum.
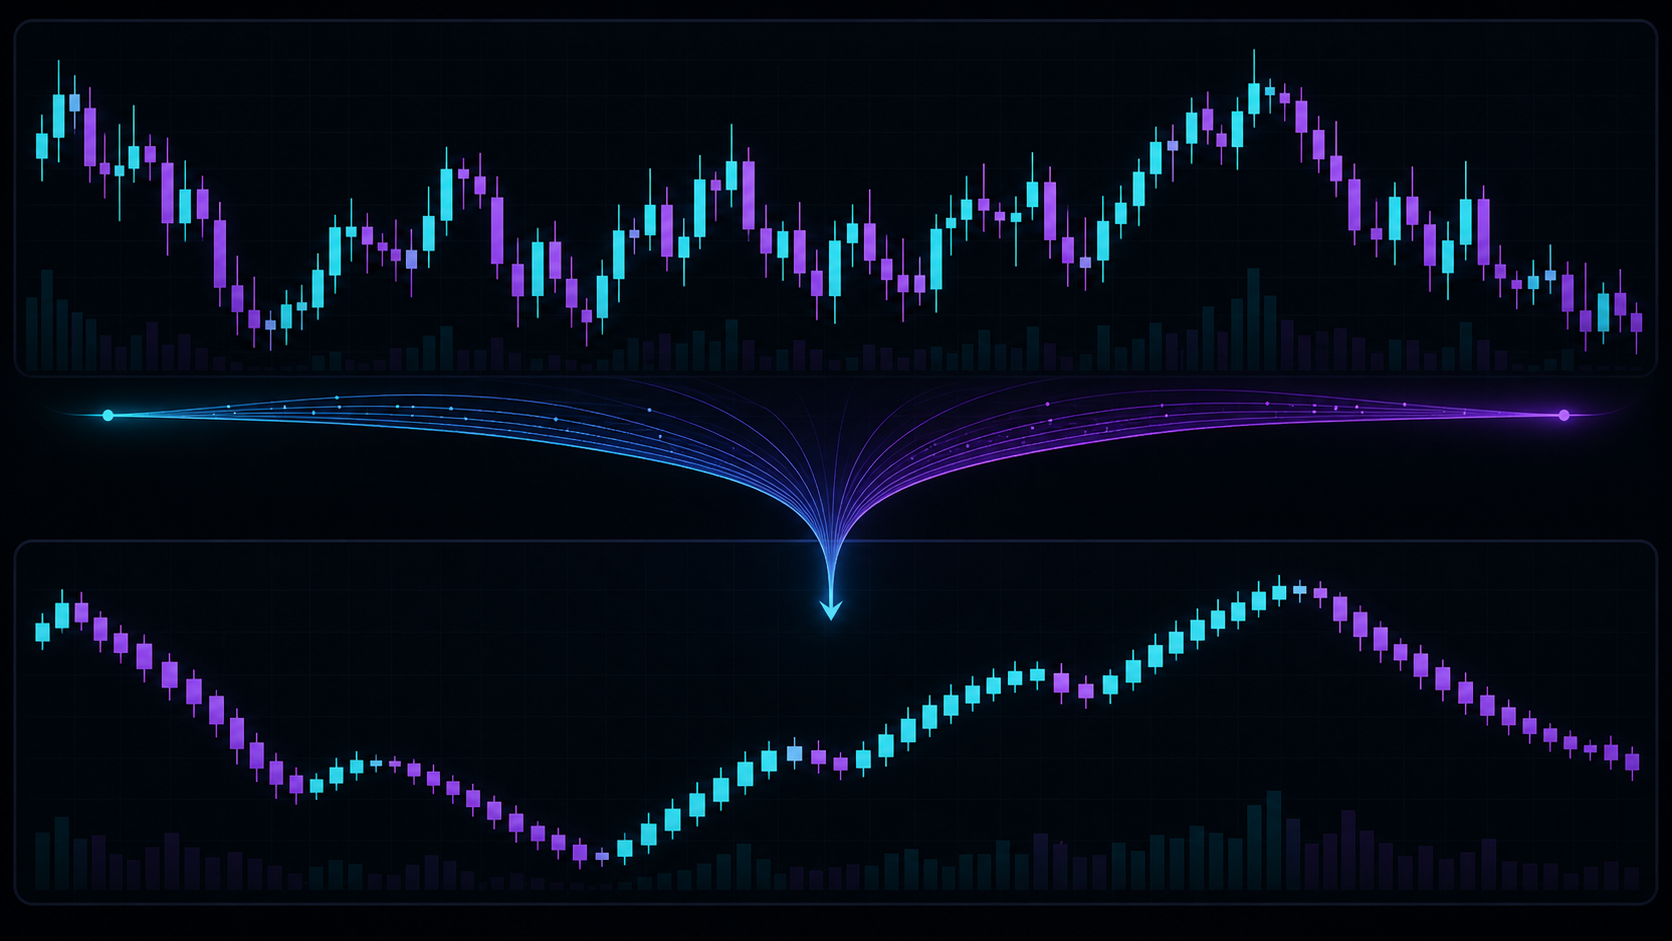
Heikin Ashi candles reduce short-term visual noise by averaging current and previous price information. They make trends easier to see, but their displayed prices are synthetic and should not be treated as exact execution prices.
How Heikin Ashi Is Different
Traditional candles display the actual open, high, low, and close of each period. Heikin Ashi candles calculate new values using averages.
Conceptually:
- the HA close averages the current open, high, low, and close;
- the HA open uses the previous HA open and close;
- the HA high and low retain relevant extremes.
Because one candle depends partly on the previous candle, abrupt changes become visually smoother.
What Heikin Ashi Helps You See
Heikin Ashi is especially useful for:
- identifying sustained direction;
- reducing distraction from alternating candle colors;
- observing momentum strengthening or weakening;
- staying focused on context during routine pullbacks;
- applying consistent trend-based rules.
Strong directional runs often show larger same-color bodies and smaller counter-direction wicks. As momentum weakens, bodies may shrink and wicks may appear on both sides.
The Trade-Off: Clarity vs Precision
Smoothing always removes some detail.
| Heikin Ashi advantage | Corresponding limitation |
|---|---|
| Cleaner directional view | More lag during rapid changes |
| Fewer distracting color flips | Displayed open and close are synthetic |
| Easier trend classification | Exact gaps and candle patterns are obscured |
| Better context consistency | Execution should use real market prices |
Heikin Ashi is best treated as a context layer, not a replacement for actual price data.
How to Read Heikin Ashi Behavior
Strong Bullish Context
Look for a sequence of bullish bodies, limited lower wicks, and orderly continuation.
Strong Bearish Context
Look for a sequence of bearish bodies, limited upper wicks, and repeated lower closes.
Possible Transition
Smaller bodies, alternating colors, and wicks on both sides suggest momentum is becoming less directional. This does not guarantee reversal; it may lead to a range or temporary pause.
A Practical Workflow
- Use Heikin Ashi to classify broad context.
- Mark structure and important zones.
- Use actual price or execution tools for entries and stops.
- Define invalidation independently of candle color.
- Avoid reacting to every isolated HA color change.
Crypto Trend and several ZenAlgo tools use smoothed context to keep the broader market state readable.
Common Mistakes
- Placing orders at the synthetic HA close.
- Assuming every color change marks a reversal.
- Ignoring support, resistance, and market structure.
- Using HA smoothing to hide excessive risk.
- Expecting the same responsiveness as raw candles.
Key Takeaways
- Heikin Ashi averages price information to reduce visual noise.
- It is useful for directional context and trend persistence.
- HA candle prices are synthetic, not exact execution prices.
- Smoothing improves clarity at the cost of some responsiveness.
- Use real price and risk rules for execution.
Continue Learning
- Compare Heikin Ashi with traditional candles.
- Learn why ZenAlgo uses Heikin Ashi.
- Study trend trading.
Heikin Ashi smoothing cannot remove market risk or reliably predict reversals. Use actual tradable prices when planning execution.