Heavy Delta - AVG Indicator
The AVG line is an adaptive reference calculated with a K-Nearest Neighbors approach. It moves with the market and helps show whether price is trading above, below, or far away from its recent adaptive value.
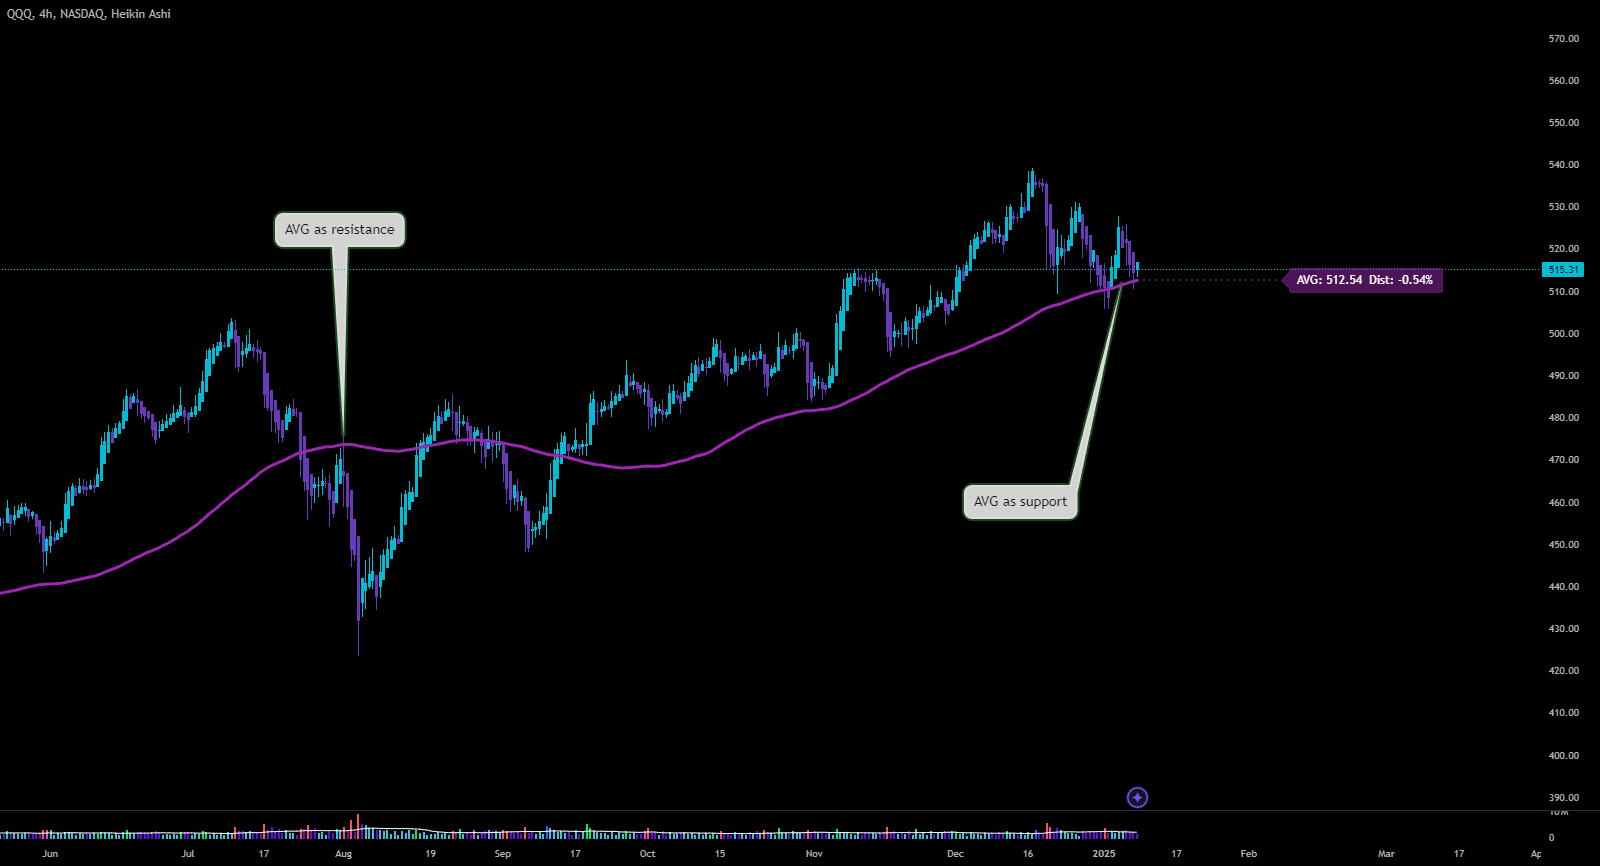
In Heavy Delta, AVG also contributes to the signal table and several combined states. Read the line itself before relying on those summaries.
What is AVG?
- Dynamic Support and Resistance: AVG adjusts from historical price data and neighboring price patterns, creating a reference that reacts to market changes.
- Psychological Price Level: AVG often serves as a psychological barrier, much like traditional support and resistance. Traders use it to gauge market sentiment, seeing where buyers and sellers find equilibrium.
The AVG indicator doesn't just follow price; it adapts, making it especially useful for identifying true support and resistance zones. Unlike traditional moving averages, AVG aligns with both historical price behavior and current market dynamics, making it a valuable anchor for decision-making.
How AVG Works
By utilizing K-Nearest Neighbors (KNN), AVG adapts to recent price action and historical patterns, creating a dynamic support and resistance level:
- Adaptive Calculations: AVG factors in the behavior of recent price movements, adapting to significant changes in market sentiment.
- Psychological Anchor: Price often gravitates around AVG, testing this level repeatedly as an equilibrium point.
- Machine Learning Patterns: AVG integrates patterns and trends from past price behavior, ensuring that it's not merely a response to recent data but an informed level based on statistically significant historical action.
AVG's machine-learning-based adaptation means it can filter out noise better than static moving averages, which often react to price fluctuations without considering broader market patterns. This makes AVG especially helpful in volatile markets.
Why Traders Use AVG
1. Dynamic Support and Resistance
AVG is a natural point of reference where price often pauses, reverses, or confirms trends. Here's how traders use it:
- As Support: When the price approaches AVG from below, it often acts as a support level, indicating a potential bounce.
- As Resistance: When approaching from above, AVG serves as resistance, potentially causing price to reverse or pause.
2. Entry and Exit Points
AVG can guide entry and exit points based on how price interacts with it:
- Entry: Many traders enter long trades when price approaches AVG from below and shows signs of holding as support.
- Exit: When price struggles to break AVG from above, it may be a signal to exit long positions or enter shorts.
Repeated testing without a break shows that price is still reacting to AVG. A later clean break may therefore matter more, but no number of prior tests guarantees another hold.
Monitor how often price tests the AVG level. Repeated rejections or bounces highlight AVG as a respected level, making it more reliable for entry or exit points.
3. Trend Confirmation
AVG helps confirm trends by showing where price aligns relative to it:
- Above AVG: Sustained price action above AVG indicates bullish momentum.
- Below AVG: Price consistently below AVG suggests bearish conditions.
This makes AVG useful for filtering out noise and identifying true breakouts compared to false signals.
Practical Uses of AVG in Trading
- Identifying Trend Strength: AVG's placement relative to price can confirm or challenge your trend analysis.
- Dynamic Entry/Exit Strategy: AVG serves as a flexible guide, adapting to changing conditions while providing a stable reference.
- Adding Confirmation with Other Indicators: Use AVG with complementary indicators like RSI or Delta to strengthen your analysis and confirm trend signals.
Using AVG in tandem with oscillators like RSI or Delta can confirm trend strength. For example, when RSI is oversold and price holds above AVG, it's a strong bullish signal. Similarly, a falling Delta and price below AVG signal bearish sentiment.
Summary
AVG is best used as an adaptive value and direction reference. Price location, distance from AVG, and the line's slope provide context; the actual entry or exit still depends on price behavior and risk.