ZenAlgo - Advanced Open Interest
Advanced Open Interest helps answer a question that price alone cannot: is the current move attracting new futures positions, or are existing positions simply being closed?
The indicator combines price change, open-interest change, and a lower-timeframe volume estimate in one dashboard. It is most useful as context for a move already visible on the chart. It does not identify an entry by itself.
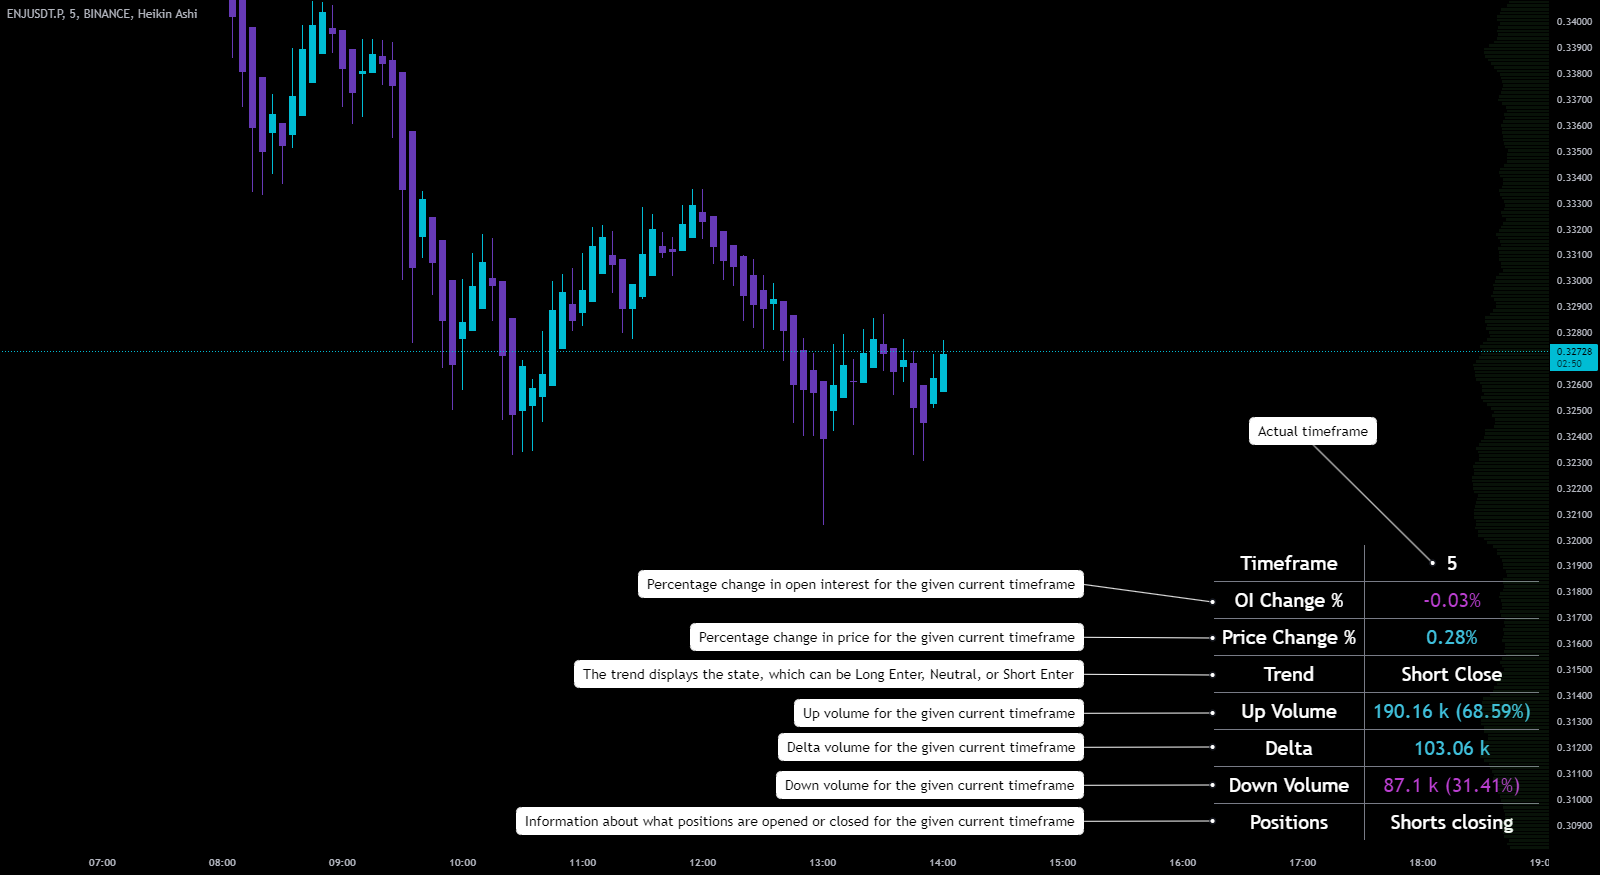
How to read the dashboard
Begin with Price Change and OI Change. Their relationship explains the position state shown by the indicator:
| Price | Open interest | Dashboard state | What it usually suggests |
|---|---|---|---|
| Rising | Rising | Long Enter | New long exposure is entering the market |
| Falling | Rising | Short Enter | New short exposure is entering the market |
| Falling | Falling | Long Close | Long exposure is being reduced |
| Rising | Falling | Short Close | Shorts are closing, which can lift price without new long participation |
The distinction matters. A rally supported by rising OI has different participation behind it than a rally caused mainly by short covering. Neither is automatically better, but they call for different expectations.
Next, read Up Volume, Down Volume, and Delta. These values estimate what happened inside the current chart candle:
- Positive delta means estimated up volume exceeded down volume.
- Negative delta means estimated down volume exceeded up volume.
- A delta that disagrees with price or OI is worth investigating. It can reveal that the move is less straightforward than the headline state suggests.
A practical reading
Imagine price and OI have risen for several candles, so the table shows Long Enter. If delta is also positive, the three readings broadly agree. If price and OI keep rising but delta turns strongly negative, the trend may still continue, but the disagreement is a reason to avoid treating the dashboard state as a simple buy signal.
The same logic applies in reverse. Short Close explains why price may rise while OI falls, but it does not prove that the rally must fail. Watch whether new positions begin to enter after the covering move.
Table values and colors
The dashboard contains:
- OI change and price change in percent
- The interpreted position state
- Up volume, down volume, and their delta
- A short positions summary
Colors make direction easier to scan, but the text and values carry the meaning. Table position, size, theme, and colors can be changed in the settings.
Important limitations
Open-interest quality depends on the selected market and data provider. The volume split is derived from lower-timeframe candles; it is not a direct feed of executed bid and ask volume.
Treat Long Enter, Short Enter, Long Close, and Short Close as descriptions of the current relationship between price and OI. Confirm them with price structure and decide risk separately.
Alerts
Advanced Open Interest currently has no built-in alert conditions. Its Long/Short states are dashboard values, not selectable TradingView alerts.