Trading Volume Explained
Volume measures how much of an asset traded during a specific period. On a chart, it is usually displayed as bars below price.
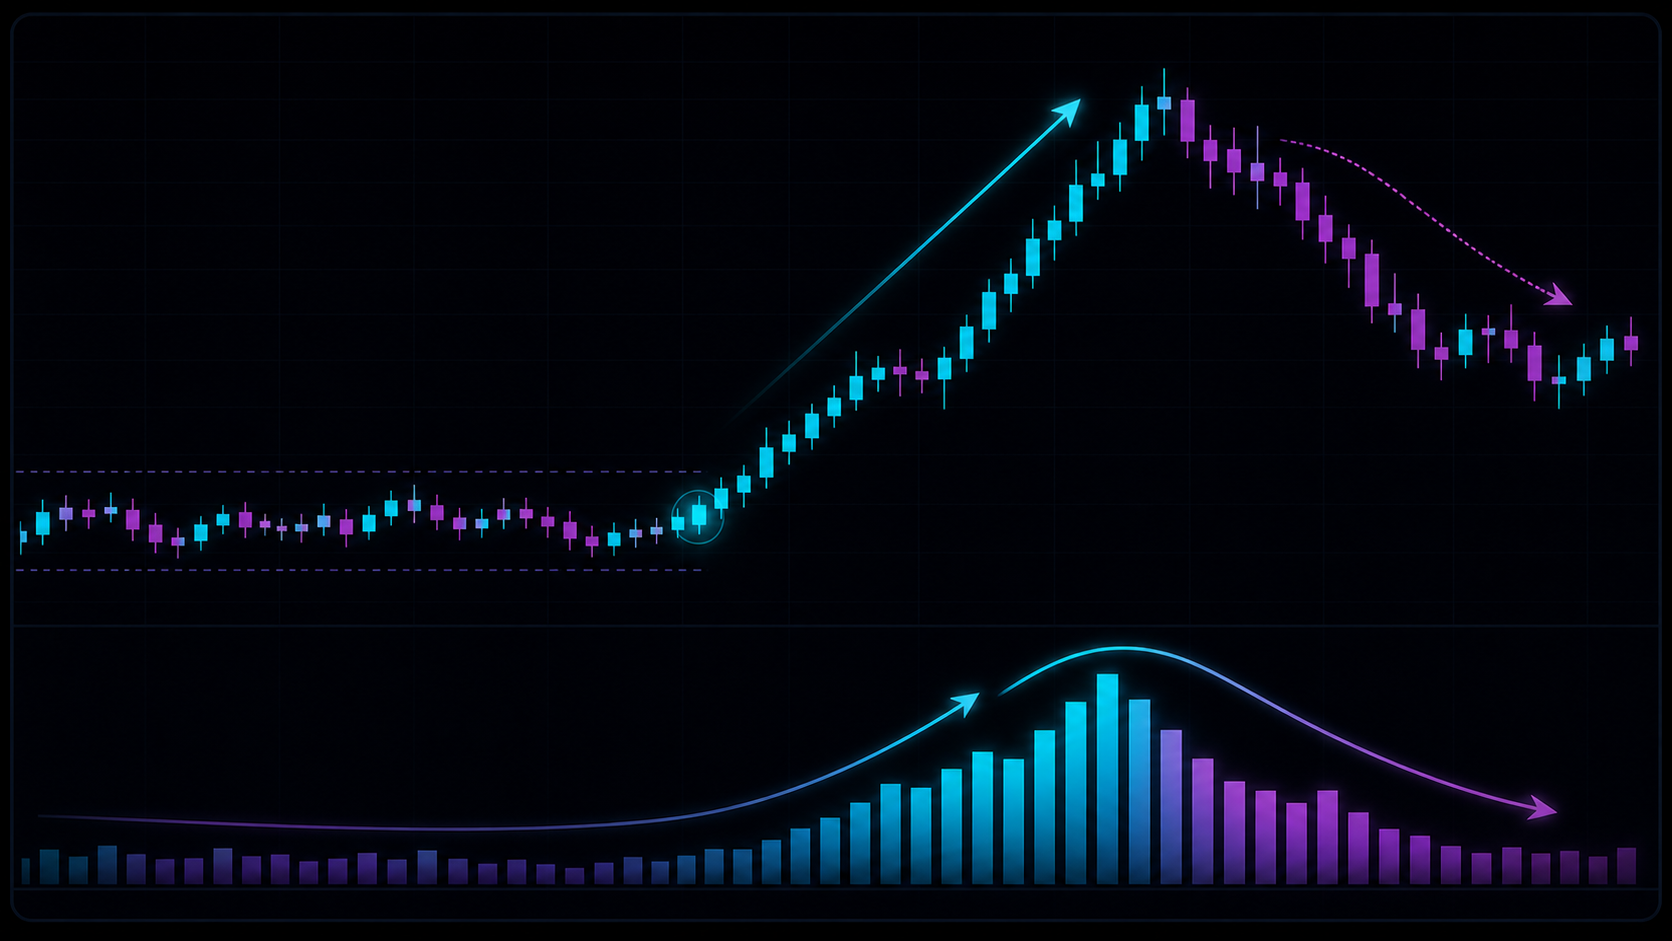
Volume helps answer whether a price move had meaningful participation behind it. A breakout with strong volume is different from a breakout that drifts higher on weak activity.
Price tells you where the market moved. Volume tells you how much activity happened while it moved.
That distinction matters. A price move with strong participation can carry a different meaning than a quiet drift through the same area. A breakout with expanding volume may show that more traders are involved. A breakout with weak volume may still work, but it deserves more caution because the move may be easier to reverse.
Volume does not predict by itself. It gives weight to the price story.
Volume Is Participation, Not Direction
A large volume bar does not automatically mean bullish or bearish. It only says activity increased.
To interpret it, look at what price did with that activity. Did the candle close near its high, near its low, or in the middle? Did price move through a level or stall at it? Did volume appear at support, resistance, VWAP, a range boundary, or in the middle of a messy area?
High volume with strong price progress can suggest active participation. High volume with little progress can suggest absorption: a lot of trading happened, but price did not move far. Low volume can make price easier to move, but it can also make execution less reliable.
Relative Volume Matters
Raw volume is less useful without comparison.
Ask whether the current volume is large compared with recent bars, normal for this session, unusual for this time of day, or happening at a meaningful level. A volume spike during a major session open may be normal. The same spike during a quiet period may be more notable.
This is why volume belongs inside context. It should be read alongside market regimes, liquidity, and value areas such as VWAP or volume profile.
How Traders Use Volume
Volume can help confirm participation during breakouts, question weak moves, identify areas where activity clustered, and highlight possible absorption or exhaustion.
For example, if price breaks resistance with expanding volume and then holds the retest, the breakout may deserve more attention. If price pokes above resistance on weak activity and quickly returns inside the range, the breakout may be vulnerable to failure.
These are not mechanical rules. They are better questions.
Using ZenAlgo
Ultimate and Heavy Delta help traders read volume as part of broader chart context. Five Elements normalizes volume alongside delta, open interest, basis, and VWAP context.
Use volume to ask whether participation confirms, contradicts, or changes the meaning of price. Do not use it as a standalone entry signal.
Continue Learning
- Study volume delta.
- Learn buying and selling pressure.
- Review liquidity.
- Practice order flow confirmation.
Volume analysis can mislead during news, low-liquidity sessions, exchange outages, and fragmented markets. Never treat volume alone as a complete trading plan.