Volume Profile, POC, VAH, and VAL
Volume profile shows how much volume traded at each price, not just during each candle.
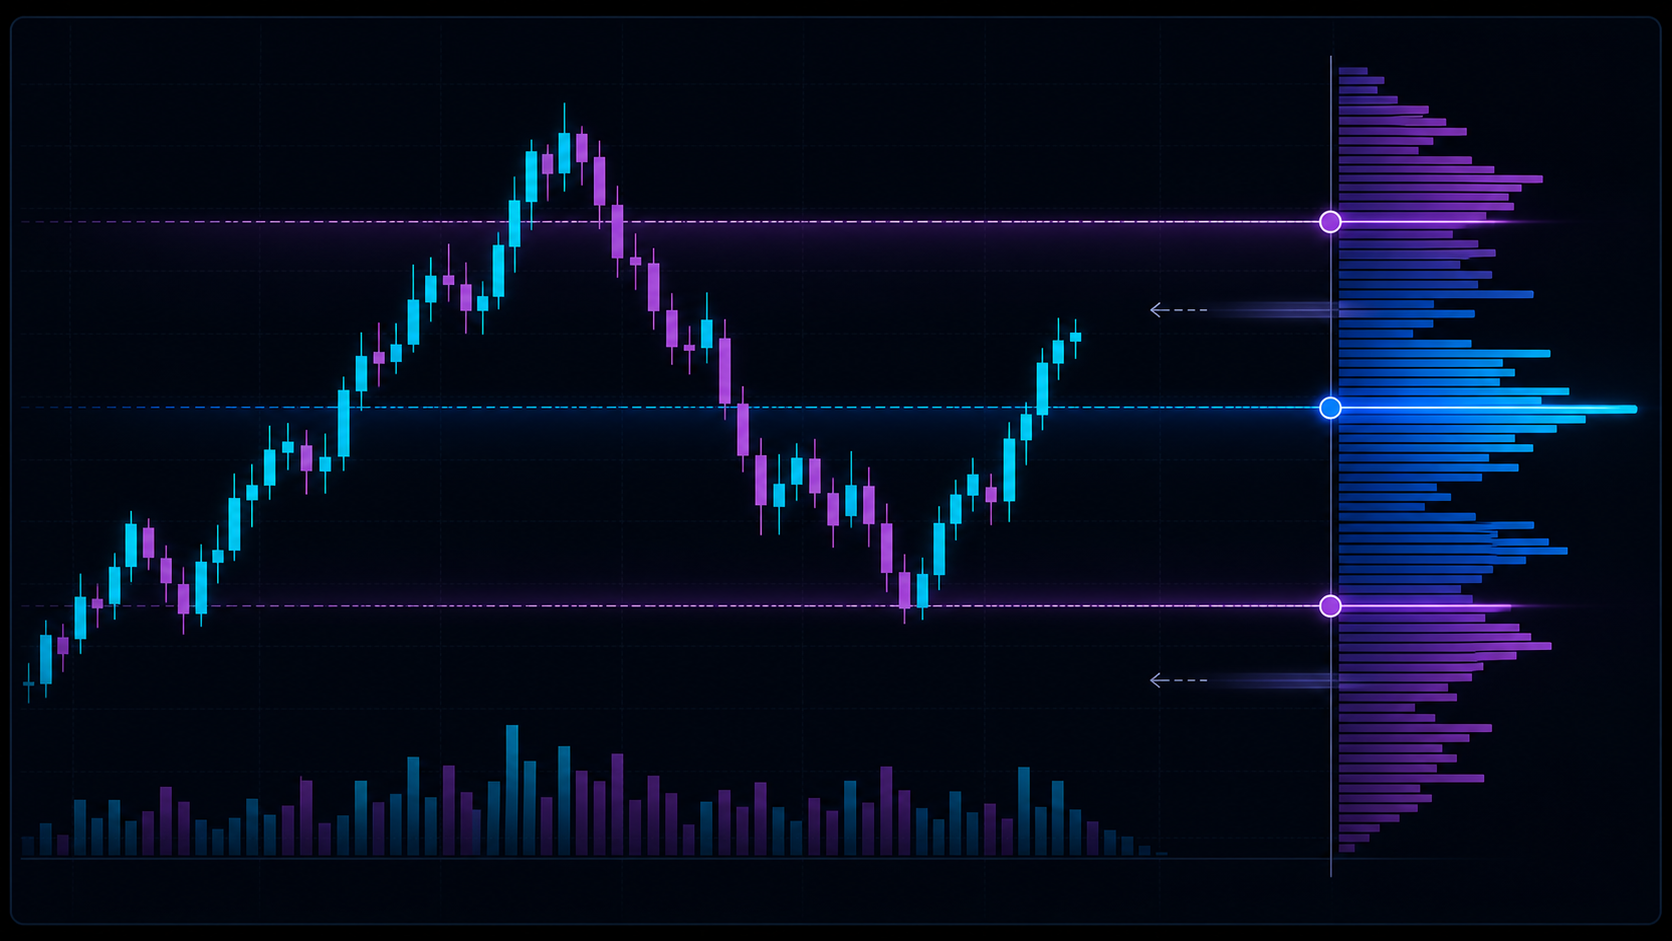
Volume profile maps acceptance and rejection. It helps traders see where the market spent time and volume, and where price moved quickly through thin areas.
Time Volume vs Price Volume
Standard volume bars answer:
How much traded during this candle?
Volume profile answers:
At which prices did trading happen?
That makes it useful for identifying value areas, magnets, and rejection zones.
Key Terms
| Term | Meaning |
|---|---|
| POC | Point of Control, the price with the most traded volume in the profile |
| VAH | Value Area High, the upper boundary of the selected value area |
| VAL | Value Area Low, the lower boundary of the selected value area |
| HVN | High Volume Node, an area of high accepted volume |
| LVN | Low Volume Node, an area where price traded lightly |
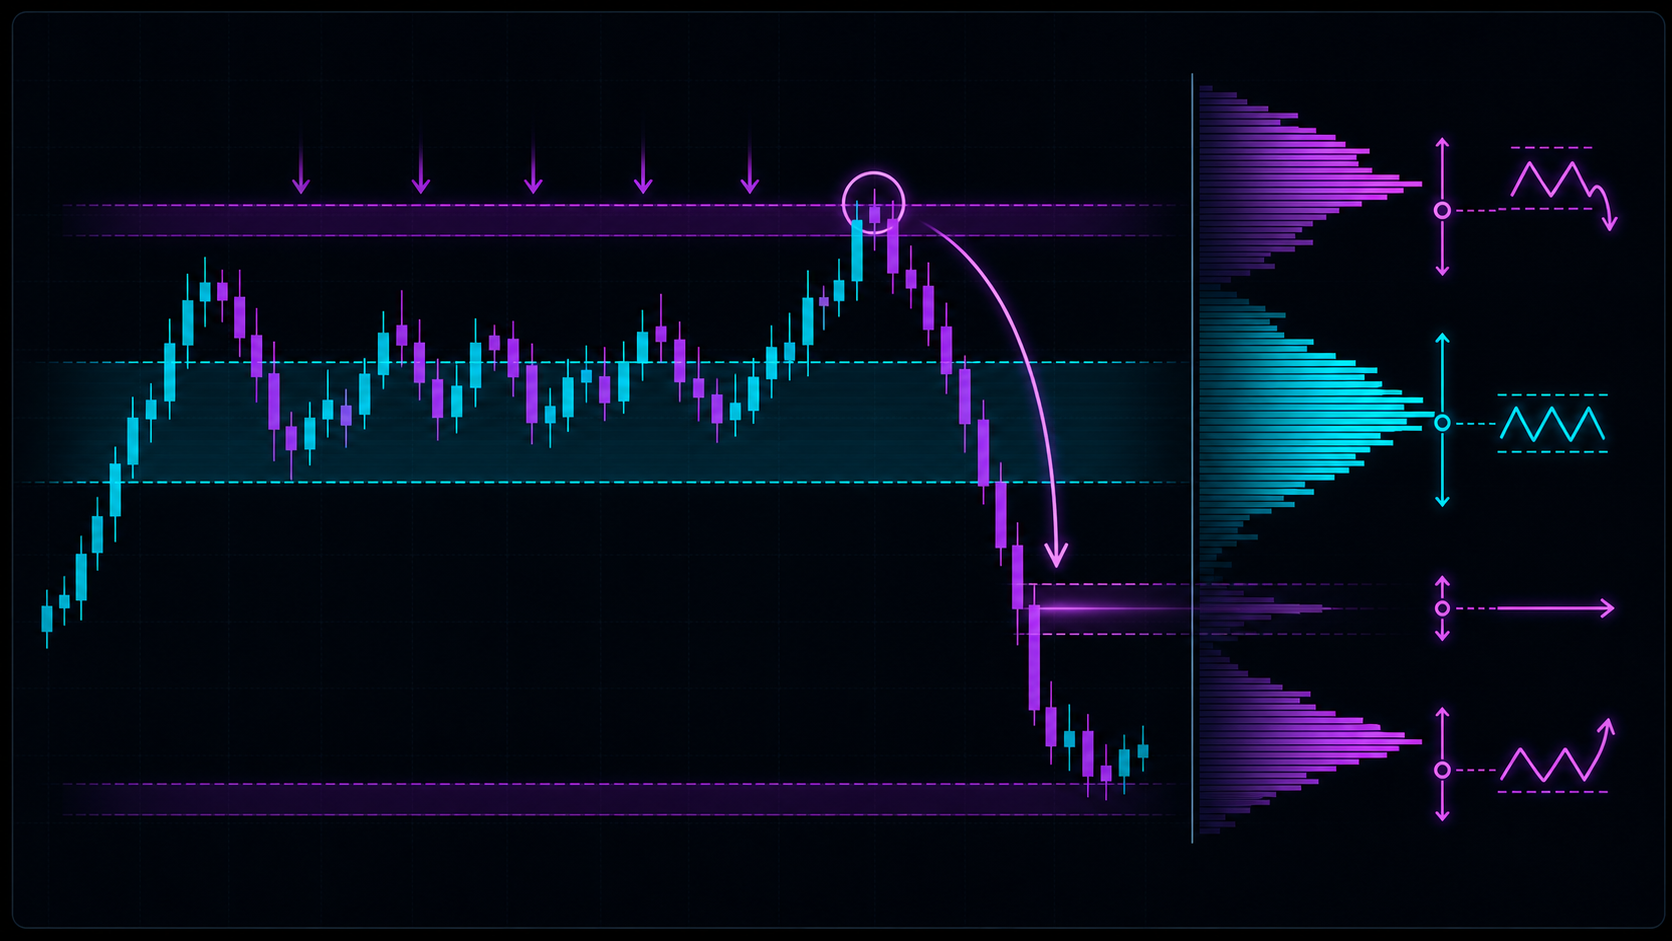
How Traders Use Profile
POC often acts like a magnet because it marks the price with the most acceptance in the selected range.
VAH and VAL define the edges of value. Price accepting above VAH can suggest expansion. Price rejecting VAH can suggest rotation back toward value. The same logic applies around VAL in the opposite direction.
LVNs can behave like fast lanes. If price enters a low-volume area with momentum, it may travel quickly toward the next accepted zone.
Profile Depends on the Selected Range
A profile of one session tells a different story than a profile of a month. Always know what period or swing the profile represents.
Ask:
- Is this profile session-based, swing-based, weekly, monthly, or custom?
- Is the POC developing or fixed?
- Is price inside value, above value, or below value?
- Is the market accepting outside value or rejecting back in?
Using ZenAlgo
Swing Volume Profile maps traded activity inside the active swing and includes POC, VAH, VAL, value mid, HVN, LVN, ditch areas, delta, and a compact dashboard.
Control places profile levels from several calendar periods directly on the chart. Avenger and Boxer also help define value and areas of interest.
Continue Learning
- Study VWAP.
- Learn order blocks.
- Explore Swing Volume Profile.
Volume profile levels are references, not guarantees. Price can slice through value levels during strong trends, news, or low-liquidity conditions.