Cumulative Volume Delta Explained
Cumulative volume delta, often called CVD, adds delta over time. Instead of reading one candle's pressure, it shows whether buying or selling pressure is building across many candles.
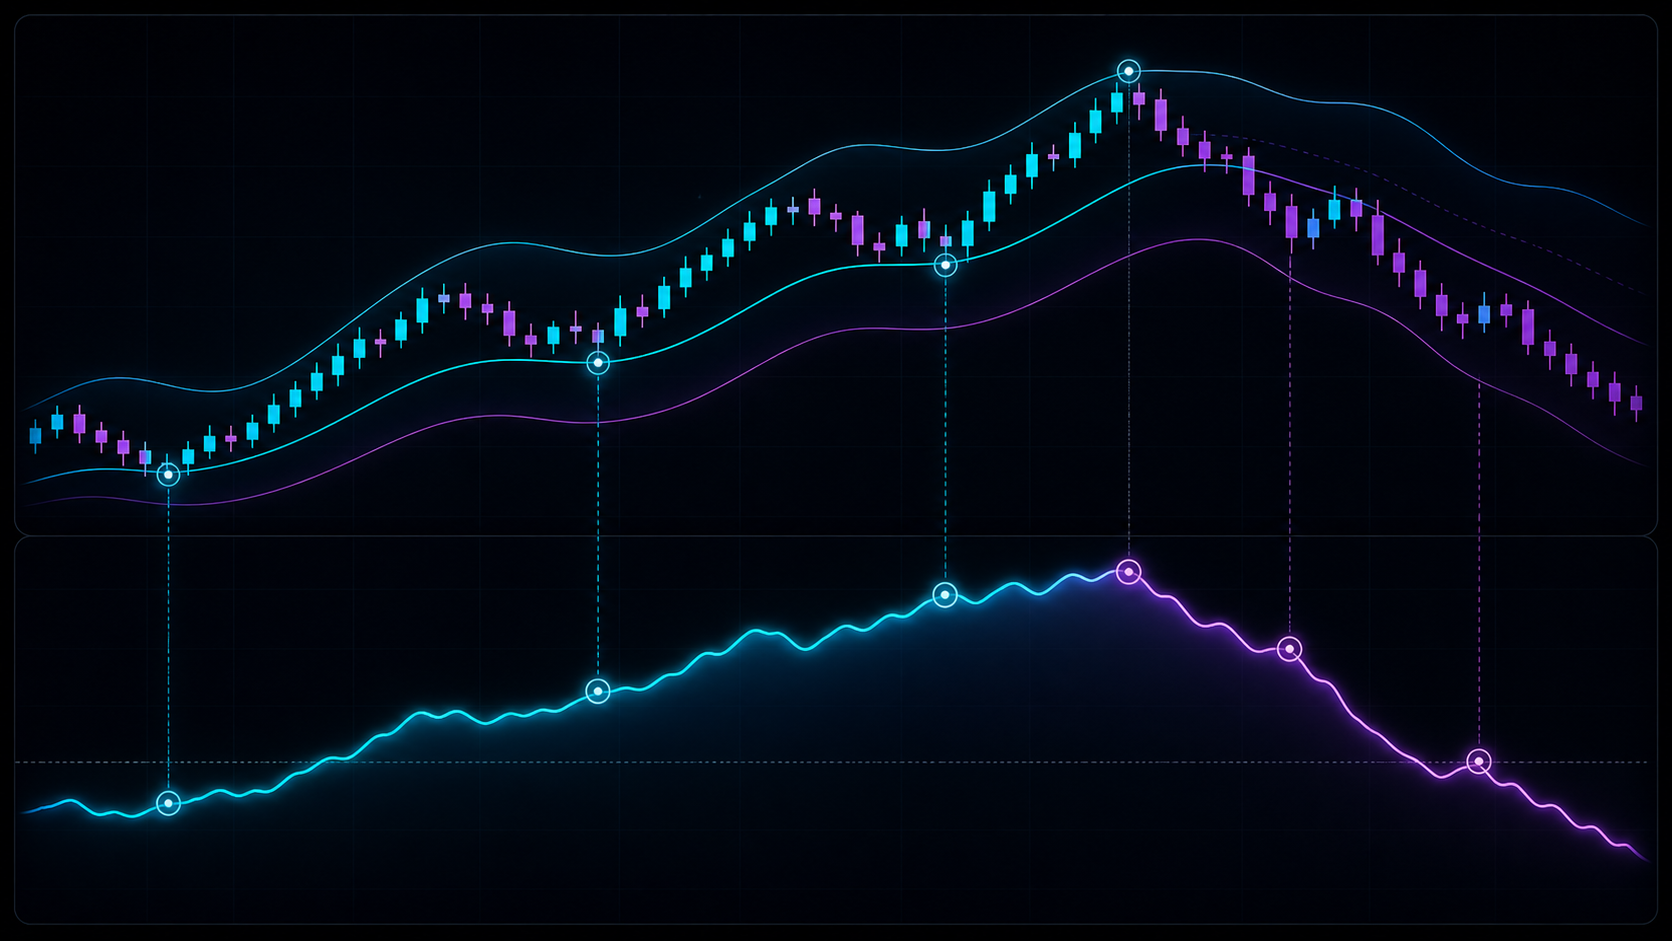
CVD turns individual delta readings into a pressure trend. It helps traders see whether participation is accumulating, distributing, confirming price, or disagreeing with it.
Delta vs Cumulative Delta
Single-candle delta answers:
What happened inside this candle?
Cumulative delta answers:
What has pressure been doing across this whole move?
That difference matters because one candle can be noisy. A persistent CVD trend can show a clearer participation pattern.
How Traders Read CVD
| Price | CVD | Common interpretation |
|---|---|---|
| Higher highs | Higher highs | Buying pressure confirms the rally |
| Lower lows | Lower lows | Selling pressure confirms the decline |
| Higher highs | Lower or flat CVD | Rally may be losing participation |
| Lower lows | Higher or flat CVD | Decline may be losing selling pressure |
The last two examples are CVD divergences.
CVD Divergence
A bullish CVD divergence can appear when price makes a lower low but cumulative delta makes a higher low. It suggests sellers pushed price lower with less internal pressure, or buyers began absorbing.
A bearish CVD divergence can appear when price makes a higher high but cumulative delta fails to make a higher high. It suggests buyers may be less aggressive than price implies.
Divergence is not a reversal signal by itself. It is a warning that the visible move and internal pressure are no longer aligned.
Why CVD Can Be Tricky
CVD depends heavily on data quality. In crypto especially, one exchange can show a different pressure story than another exchange.
CVD can also trend strongly in one direction while price pauses. That may be absorption, but it can also mean the market is preparing for another continuation attempt.
Using ZenAlgo
Detector helps visualize pressure shifts and regime-like changes. Delta and Heavy Delta are also useful companions when studying how participation confirms or disagrees with price.
For stronger context, compare CVD with market structure, support and resistance, and volume.
Practical Checklist
- Is CVD trending with price?
- Is CVD flattening while price extends?
- Is divergence forming at a meaningful level?
- Is price structure confirming the warning?
- Is volume expanding or fading?
- Is the trade still valid if CVD keeps disagreeing?
Continue Learning
- Learn buying and selling pressure.
- Study price and delta divergence.
- Explore Detector.
CVD can diverge for longer than expected. Do not short a strong trend or buy a weak market only because CVD disagrees.