Regular Bullish and Bearish Divergence
Regular divergence is the classic divergence most traders learn first. It usually warns that the current move may be losing strength.
Regular divergence is an exhaustion warning. It looks for price making a new extreme while momentum fails to confirm that extreme.
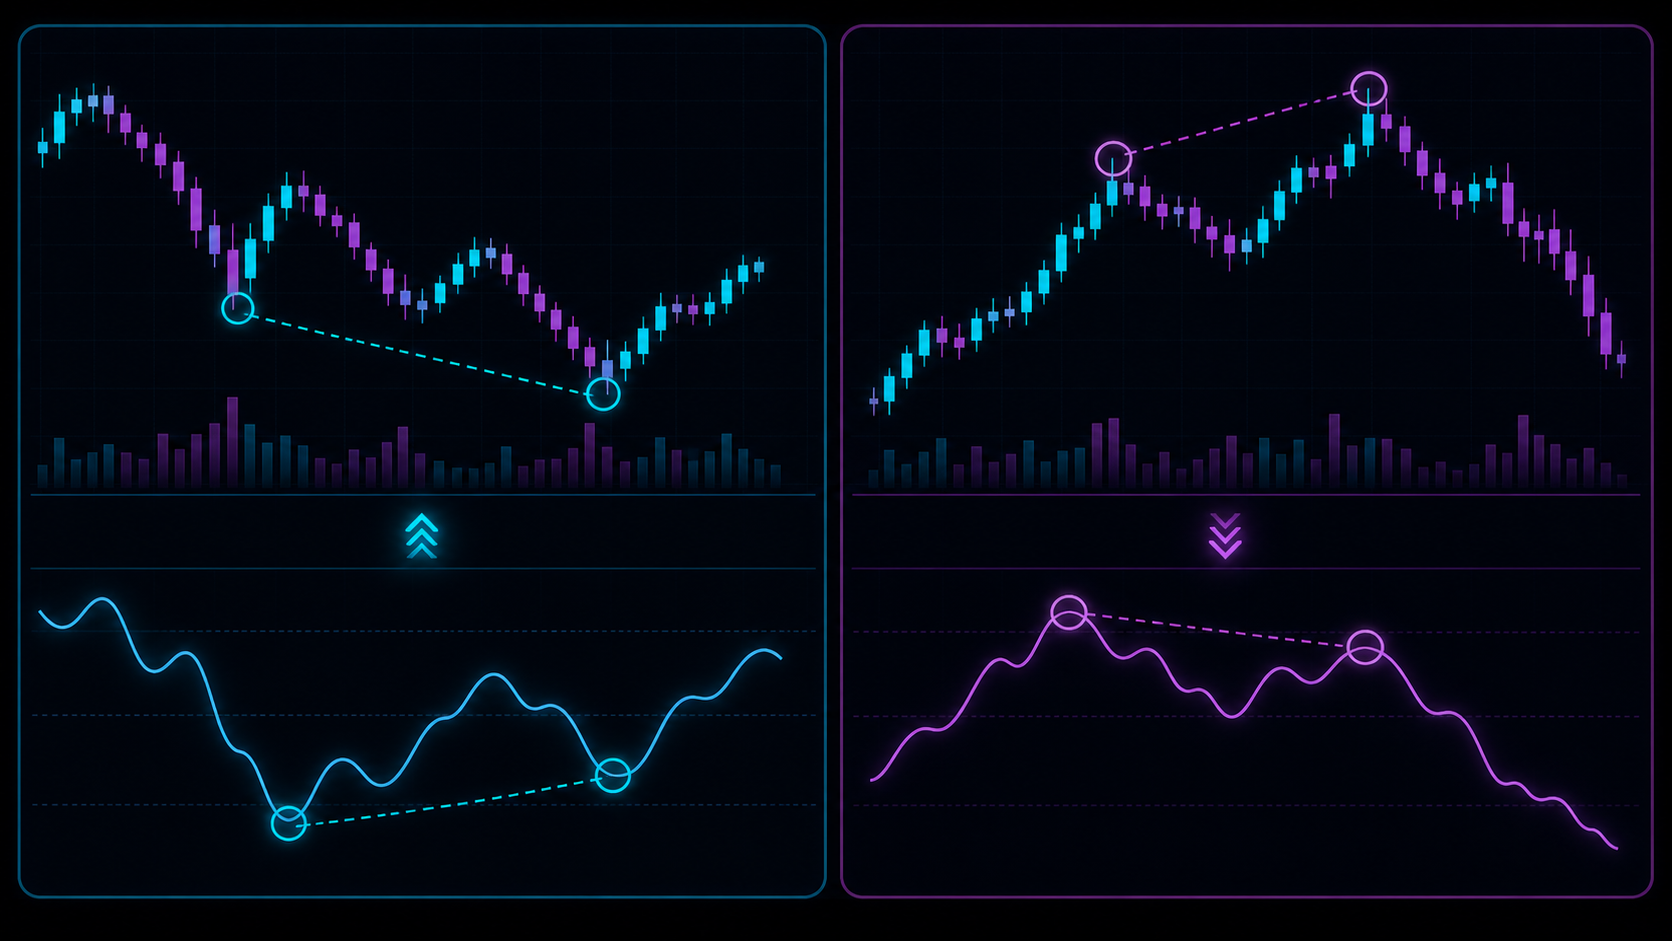
Regular Bullish Divergence
Regular bullish divergence forms when:
- price makes a lower low;
- the oscillator, momentum reading, or delta makes a higher low.
Price is still pushing down, but internal pressure is not confirming the new low with the same strength.
This can appear near:
- support;
- oversold momentum;
- a failed breakdown;
- a high-volume low that does not continue lower;
- a value-area reclaim.
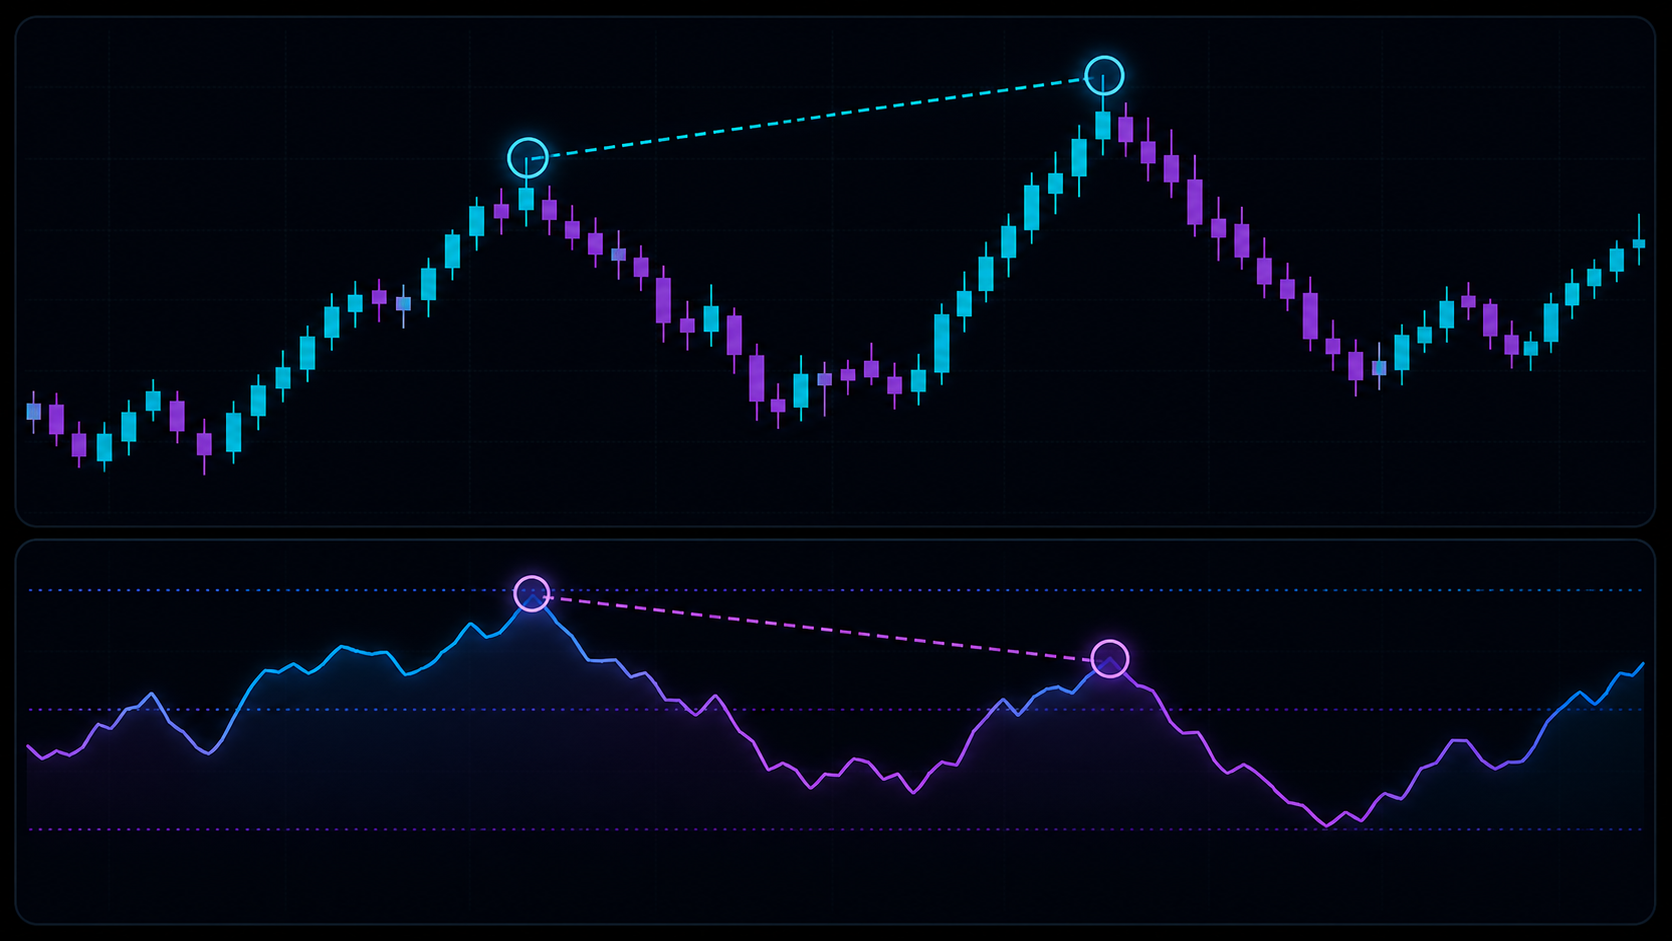
Regular Bearish Divergence
Regular bearish divergence forms when:
- price makes a higher high;
- the oscillator, momentum reading, or delta makes a lower high.
Price is still pushing up, but internal momentum is weaker than before.
This can appear near:
- resistance;
- overbought momentum;
- a failed breakout;
- a high-volume top that does not continue higher;
- rejection from VWAP or value.
Why Regular Divergence Needs Location
A bearish divergence in the middle of a strong uptrend can fail repeatedly. A bullish divergence in a heavy downtrend can also fail repeatedly.
Regular divergence becomes more useful when it appears at a meaningful level and price begins to confirm a change.
Using ZenAlgo
Waves marks regular divergence with R labels on Wave or MoneyFlow context. Advanced RSI and Q also help identify oscillator disagreement.
Pair regular divergence with support and resistance, market structure, and volume profile.
Practical Checklist��
- Did price make a real new high or low?
- Did the indicator fail to confirm that new extreme?
- Is the divergence at a meaningful level?
- Is the broader market trending strongly?
- Has price confirmed with a break, reclaim, or failed breakout?
- Where is invalidation?
Continue Learning
- Study hidden divergence.
- Learn how to confirm a divergence.
- Explore Waves divergences.
Regular divergence can warn about exhaustion, but exhaustion can lead to a pause instead of a reversal. Always wait for price confirmation.