Hidden Bullish and Bearish Divergence
Hidden divergence is a continuation concept. Instead of warning that a trend may reverse, it often suggests the trend may still have strength after a pullback.
Hidden divergence is usually trend-following. It appears when price holds a better structure level while the indicator makes a deeper correction.
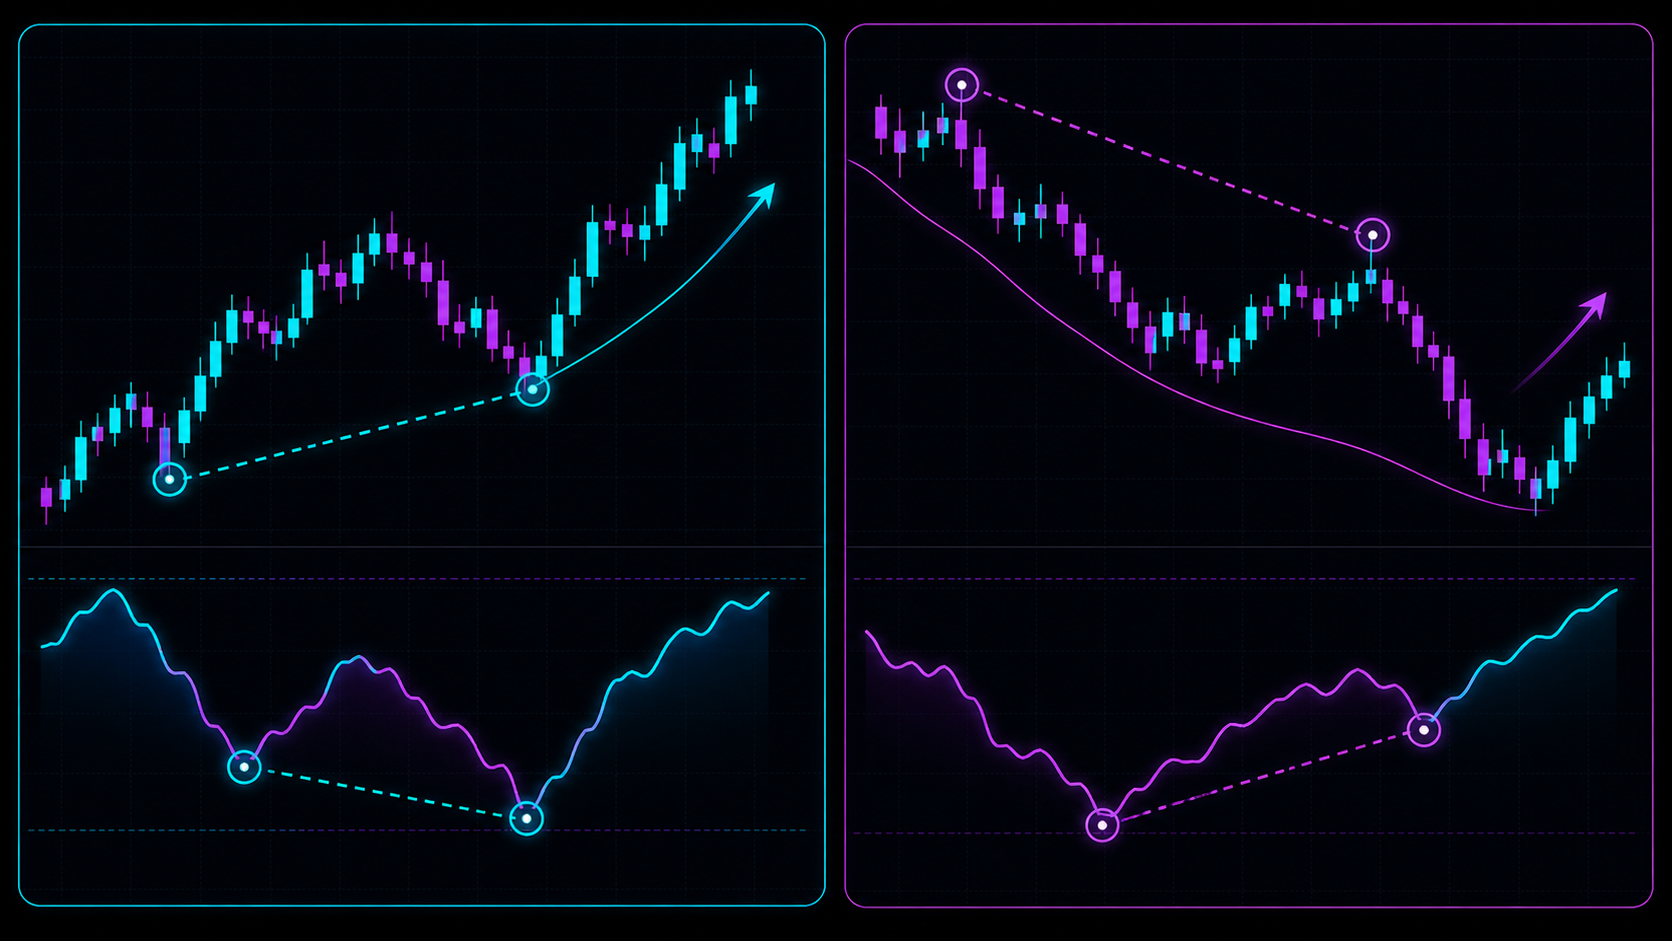
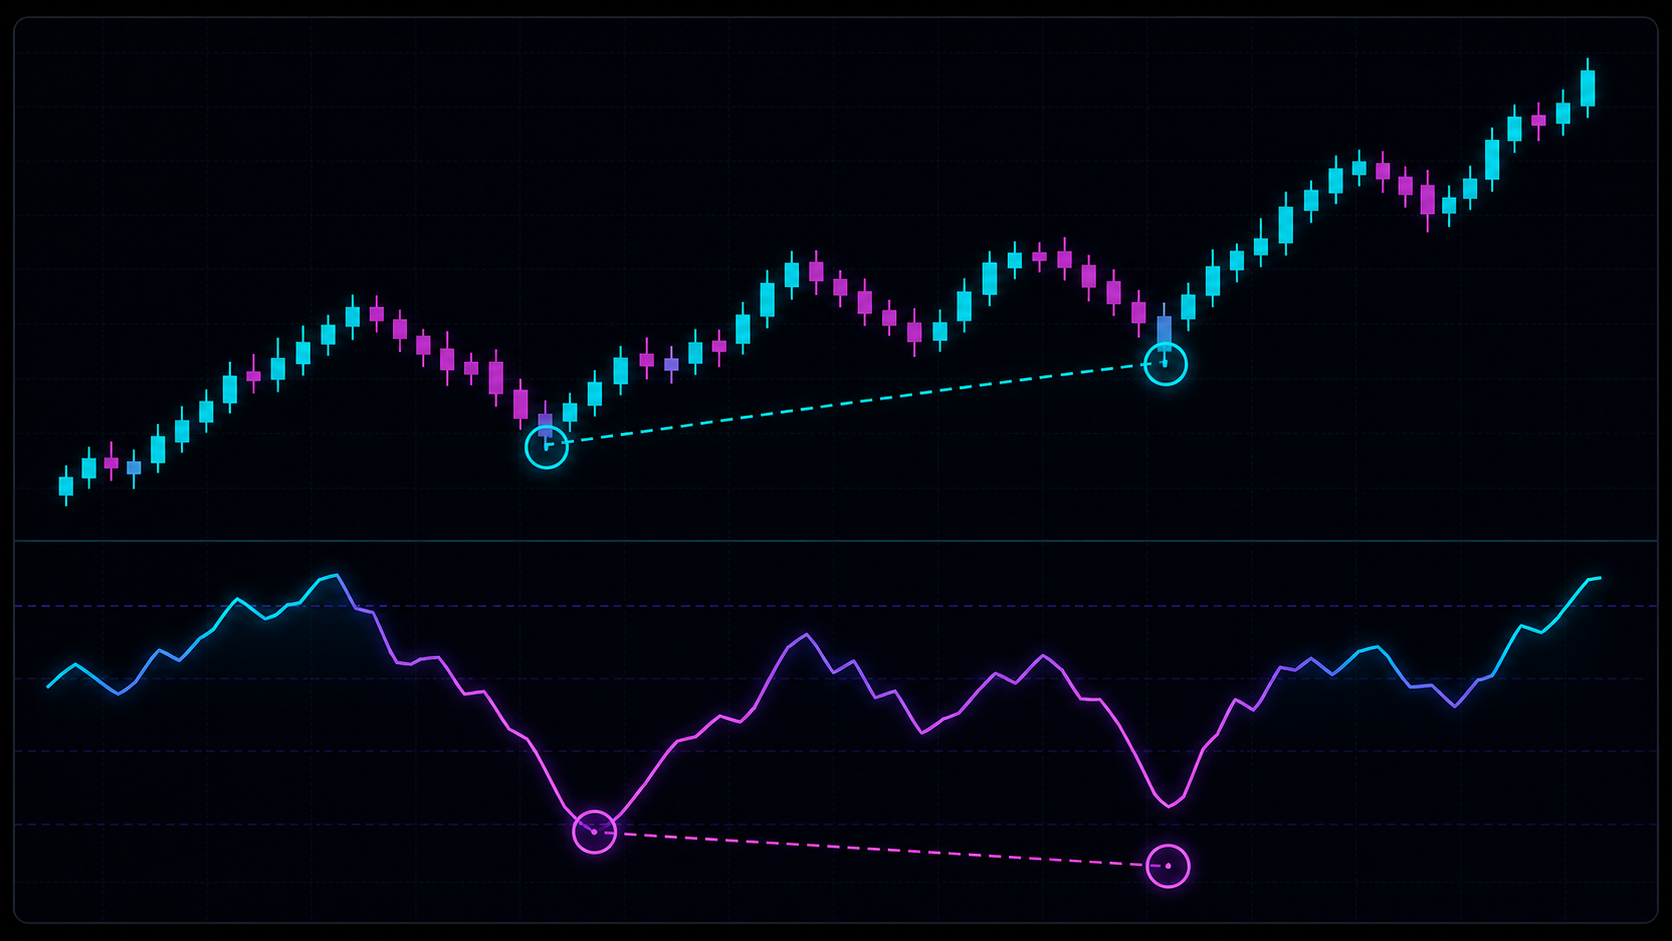
Hidden Bullish Divergence
Hidden bullish divergence forms when:
- price makes a higher low;
- the oscillator or momentum reading makes a lower low.
Price holds above the prior swing low, but the indicator pulls deeper. This can suggest the pullback cleaned out momentum without breaking the bullish structure.
It is most relevant in an uptrend.
Hidden Bearish Divergence
Hidden bearish divergence forms when:
- price makes a lower high;
- the oscillator or momentum reading makes a higher high.
Price fails to reclaim the prior high, but the indicator bounces harder. This can suggest the bounce refreshed momentum without breaking bearish structure.
It is most relevant in a downtrend.
Why Trend Context Matters
Hidden divergence is weak if the trend is unclear.
Before using it, ask:
- Is the market actually trending?
- Did price hold a higher low or lower high?
- Is the signal aligned with the higher timeframe?
- Is there enough room to the target?
- Does volume or delta support continuation?
Using ZenAlgo
Waves and Advanced RSI mark hidden divergence with H labels. Q also includes hidden divergence context.
Use Avenger or ADX to avoid treating hidden divergence as meaningful when the market is not trending.
Hidden vs Regular Divergence
| Type | Main purpose | Common context |
|---|---|---|
| Regular divergence | Exhaustion or reversal warning | Near extreme highs or lows |
| Hidden divergence | Continuation warning | During pullbacks in a trend |
Continue Learning
- Study regular divergence.
- Learn why divergences fail.
- Review trend trading.
Hidden divergence can fail when the trend is already exhausted or when the pullback becomes a real reversal. Structure comes first.