Waves - Use Cases
This page shows how to turn the Waves components into a repeatable reading process. The examples are scenarios to inspect, not instructions to enter immediately.
Overview of the Waves Indicator
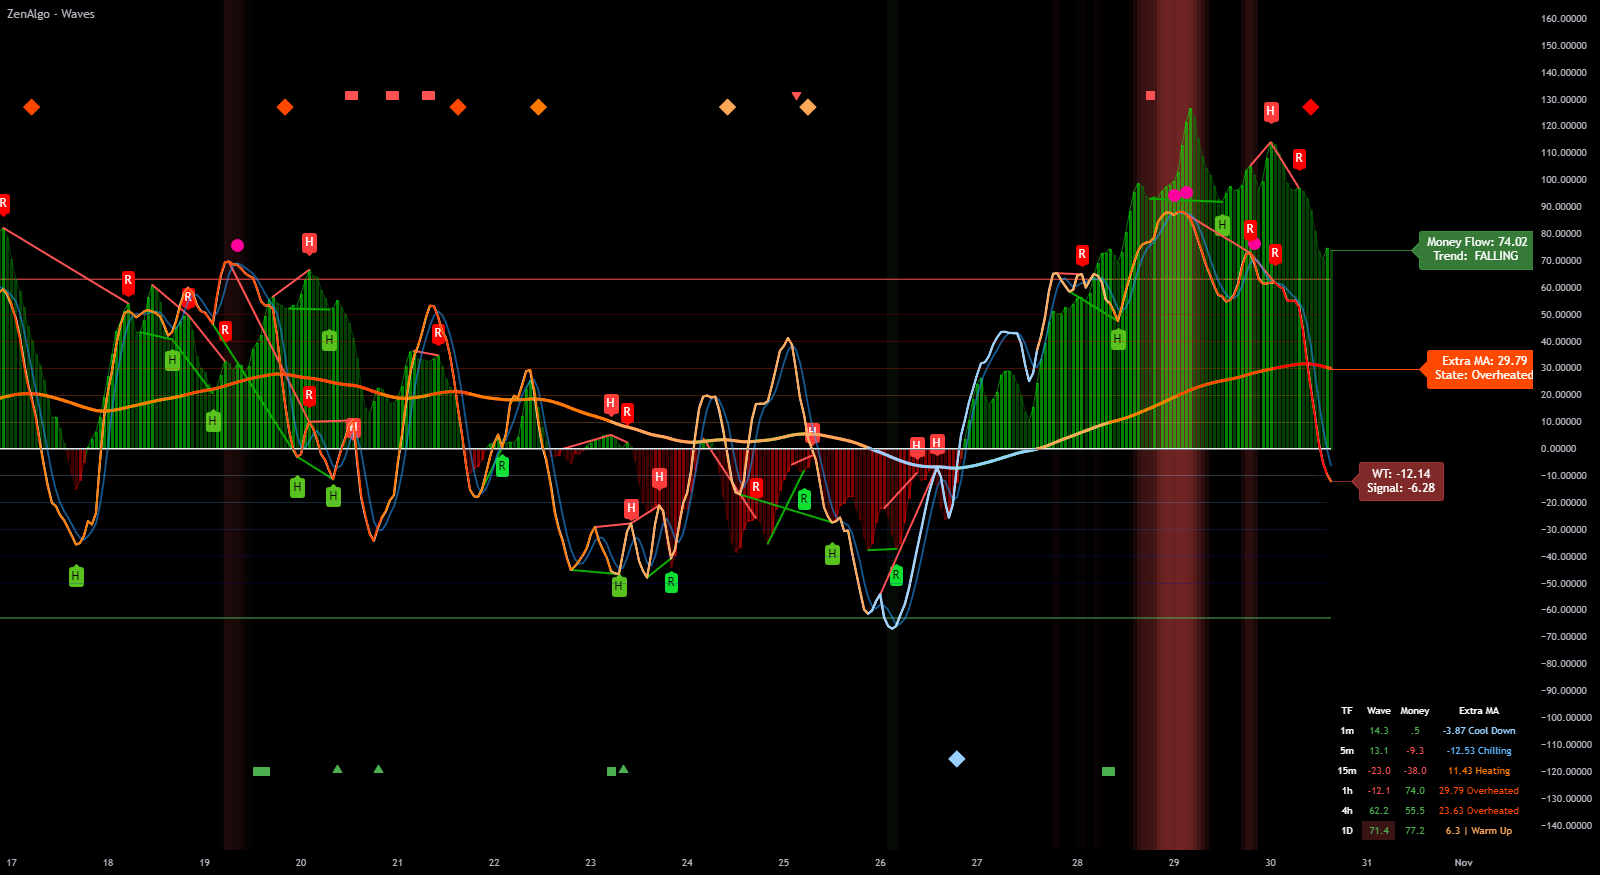
The Wave line is the primary trend indicator, and the Signal line is a smoothed version of Wave that serves as a guide for identifying trend direction. Crossovers between Wave and Signal help determine if a trend is bullish (upward) or bearish (downward).
How to Use the Waves Indicator for Trend Identification
- Identify Trend Direction: When Wave crosses above Signal, it signals a bullish trend. Conversely, Wave crossing below Signal indicates a bearish trend.
- Use Crossovers as Change Markers: A crossover shows that short-term momentum changed. Price location and follow-through determine whether it is useful.
- Monitor Trend Continuation: If Wave stays above Signal, it suggests that the bullish trend is continuing. Similarly, Wave remaining below Signal indicates a continuing bearish trend.
To strengthen your trend analysis, combine Wave and Signal crossovers with support or resistance levels, as this often confirms the validity of the signal.
Short Position Triggers
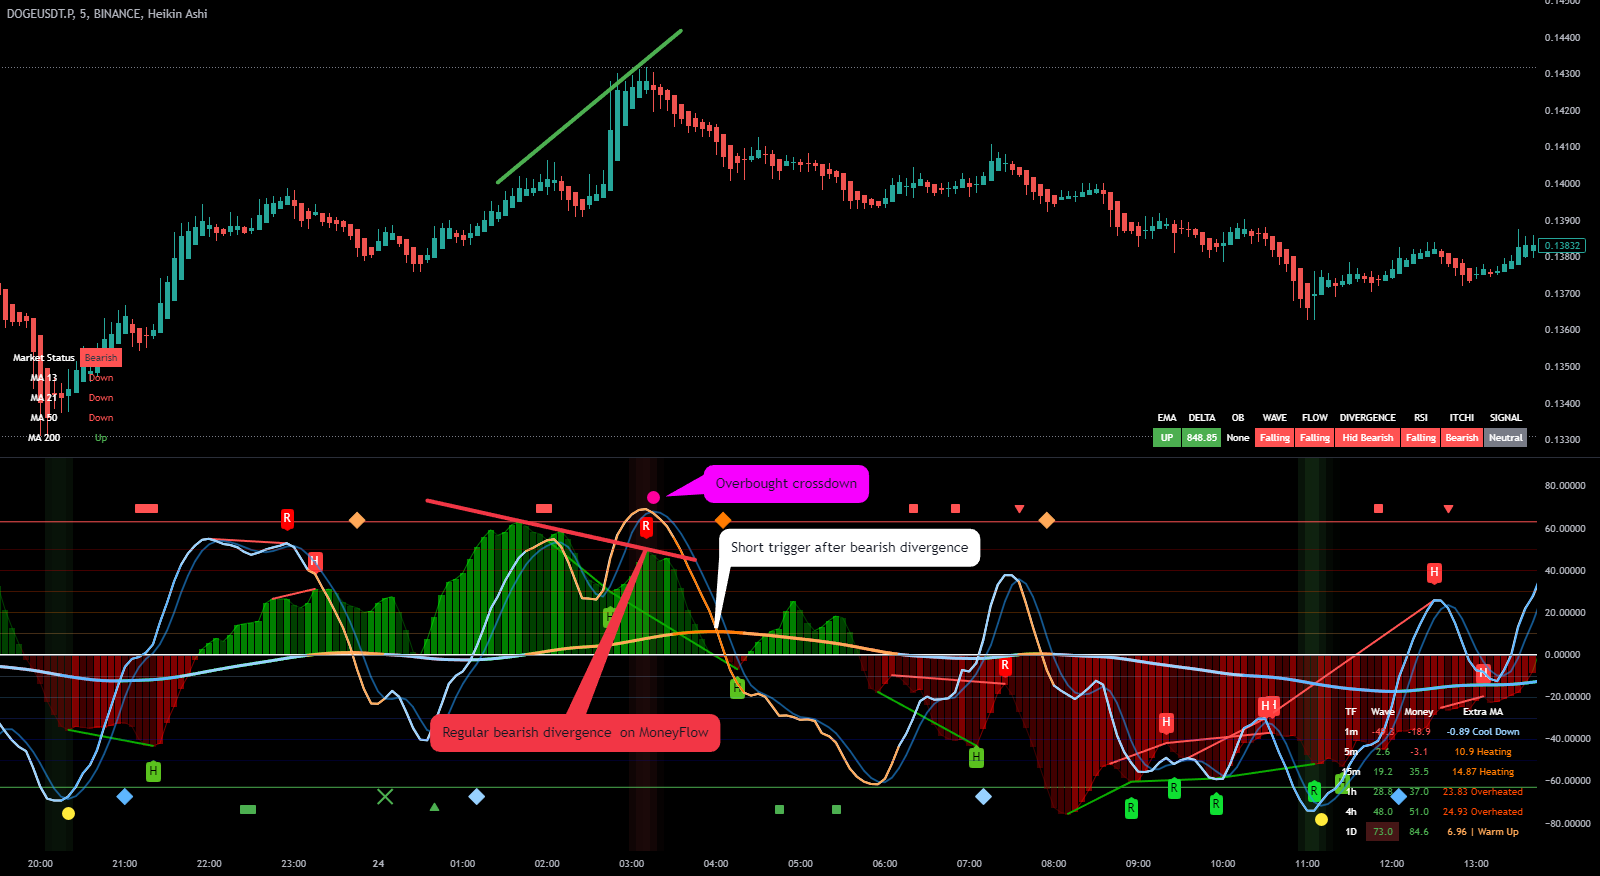
Short position triggers occur when the Wave line crosses below the Signal line and the values exceed a specific threshold known as the Overbought Level (OBL). Multiple overbought levels in the Waves indicator (WT indicators) are used to identify potential corrections in an overbought market.
How to Use Short Position Triggers
- Enter Short Trades: When Wave crosses below Signal and exceeds the OBL, this indicates a potential short entry point.
- Monitor for Bearish Continuation: Once the short position is triggered, monitor the Wave line to confirm that it stays below Signal for continued bearish momentum.
- Use Overbought Levels: The overbought levels help filter out weak signals by indicating only the strongest bearish setups.
Use short position triggers in combination with resistance levels to increase the accuracy of your entries. When Wave crosses below Signal near a resistance level, it typically indicates a stronger bearish reversal.
Long Position Triggers
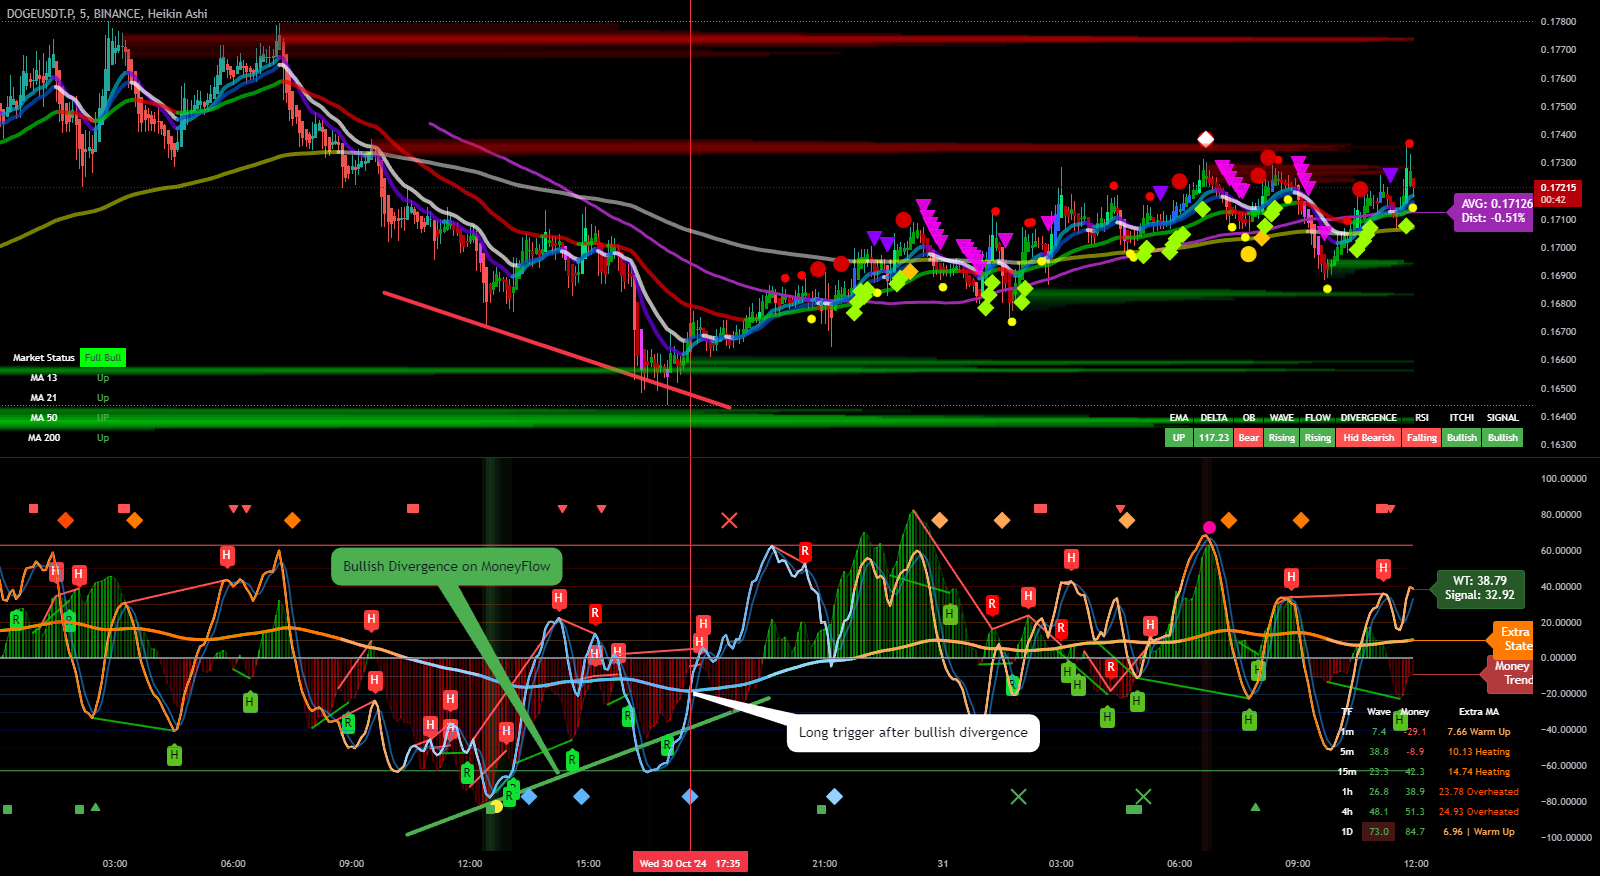
Long position triggers occur when the Wave line crosses above the Signal line while the values are below the Oversold Level (OSL). This signal suggests that the market may be oversold and ready for a bullish reaction, presenting buying opportunities.
How to Use Long Position Triggers
- Enter Long Trades: When Wave crosses above Signal below the OSL, this marks a potential buy signal.
- Look for Bullish Continuation: After entry, monitor the Wave line to ensure it stays above Signal, indicating that the upward momentum continues.
- Focus on Oversold Conditions: By entering trades when Wave is below OSL, you're targeting positions when the market is oversold and potentially poised for a reversal.
Long position triggers are most effective when they align with support levels. When Wave crosses above Signal near support, the likelihood of a successful trade increases.
Combined Long and Short Signals
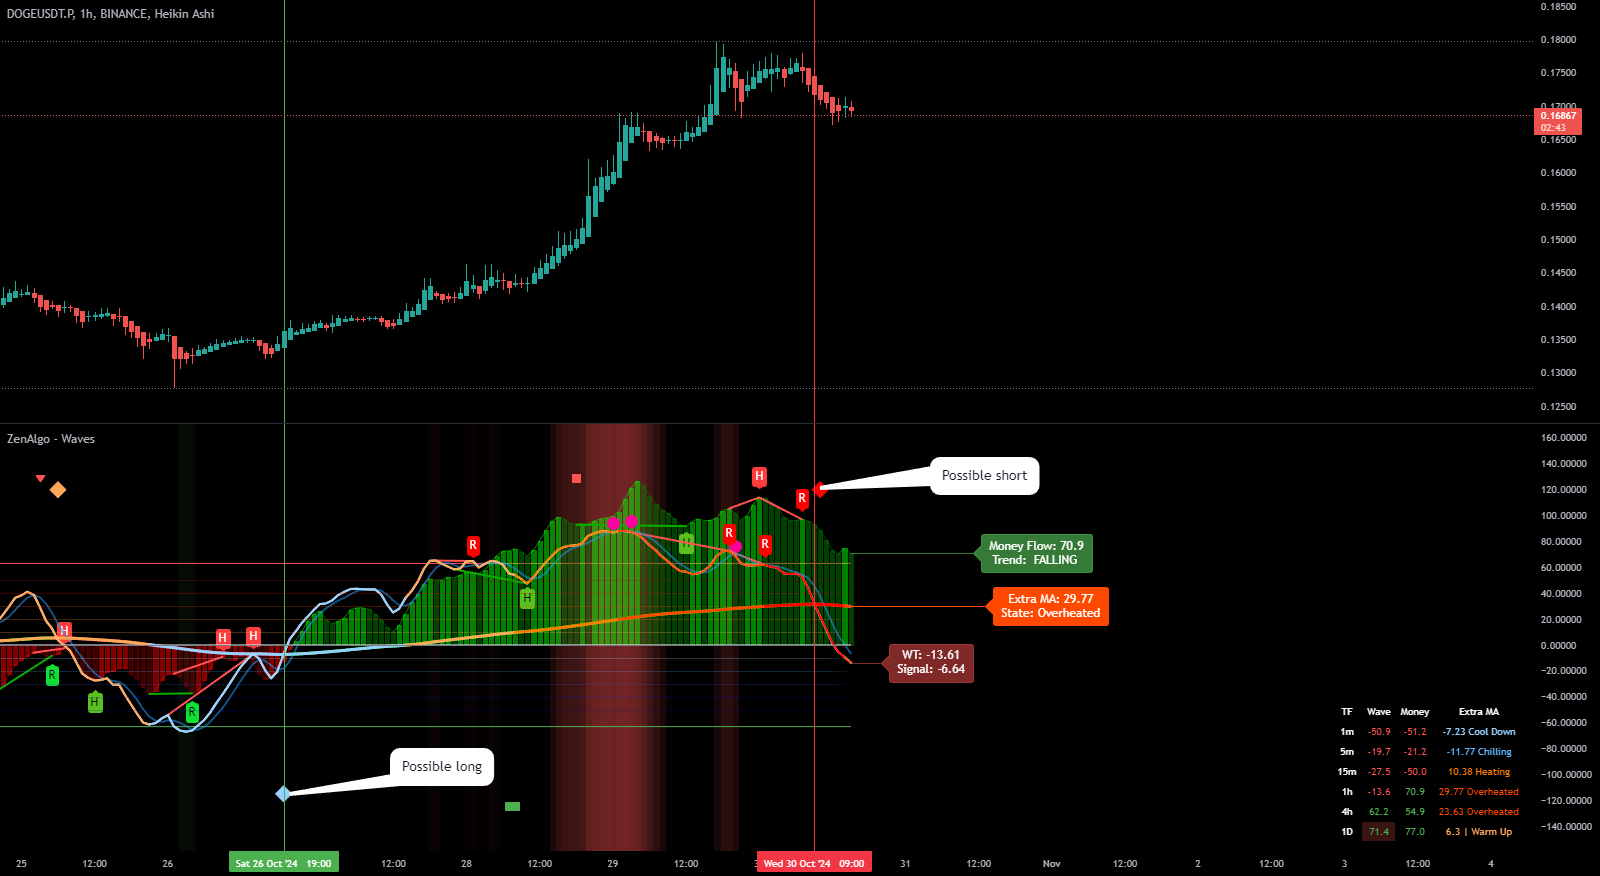
The combined signals of long and short triggers provide a holistic view of potential entries and exits on the price chart. Visual indicators, such as circles or triangles, are used to mark both long and short signals directly on the chart, allowing traders to see trend shifts at a glance.
How to Use Combined Signals
- Identify Market Sentiment: Use the presence of both long and short signals to gauge overall market sentiment. For example, a predominance of long signals may indicate bullish momentum.
- Track Trend Reversals: Combined signals make it easier to spot reversal patterns by highlighting when short signals transition to long signals, or vice versa.
- Adapt Strategy with Signals: Tailor your trading strategy to follow the predominant signal type. If short signals are frequently triggered, consider focusing on short trades until a reversal occurs.
Compare combined signals with MoneyFlow, volume, and price structure to see whether the reading is supported.
Summary of Use Cases
- Trend Identification: Use Wave and Signal crossovers to identify bullish or bearish trends.
- Short scenarios: Inspect bearish crosses that occur above the Overbought Level (OBL).
- Long scenarios: Inspect bullish crosses that occur below the Oversold Level (OSL).
- Combined Signals: Visual markers of long and short signals help confirm trend reversals or continuation patterns.
These use cases organize the panel into a sequence: identify momentum, note the location, check MoneyFlow and other filters, then wait for price confirmation.