Waves - Other Indicators
Waves includes several supporting components that explain the main oscillator from a different angle. They are most useful as context for the Wave and signal line rather than as separate signals.
Overview of Additional Indicators
This page covers the following complementary indicators:
- Extra Moving Average (MA)
- Background Color Coding for Overbought/Oversold Regions
- MoneyFlow Indicator
- Multi-Timeframe Data Table
- Overbought and Oversold Levels (OBL and OSL)
Each section provides a description, visual example, and guidance for practical use.
1. Extra Moving Average (MA)
The Extra Moving Average (MA) is an additional trend line integrated into the Waves structure to help assess the broader trend. The MA's state is color-coded in the multi-timeframe table, providing a quick visual reference for trend direction across different timeframes.
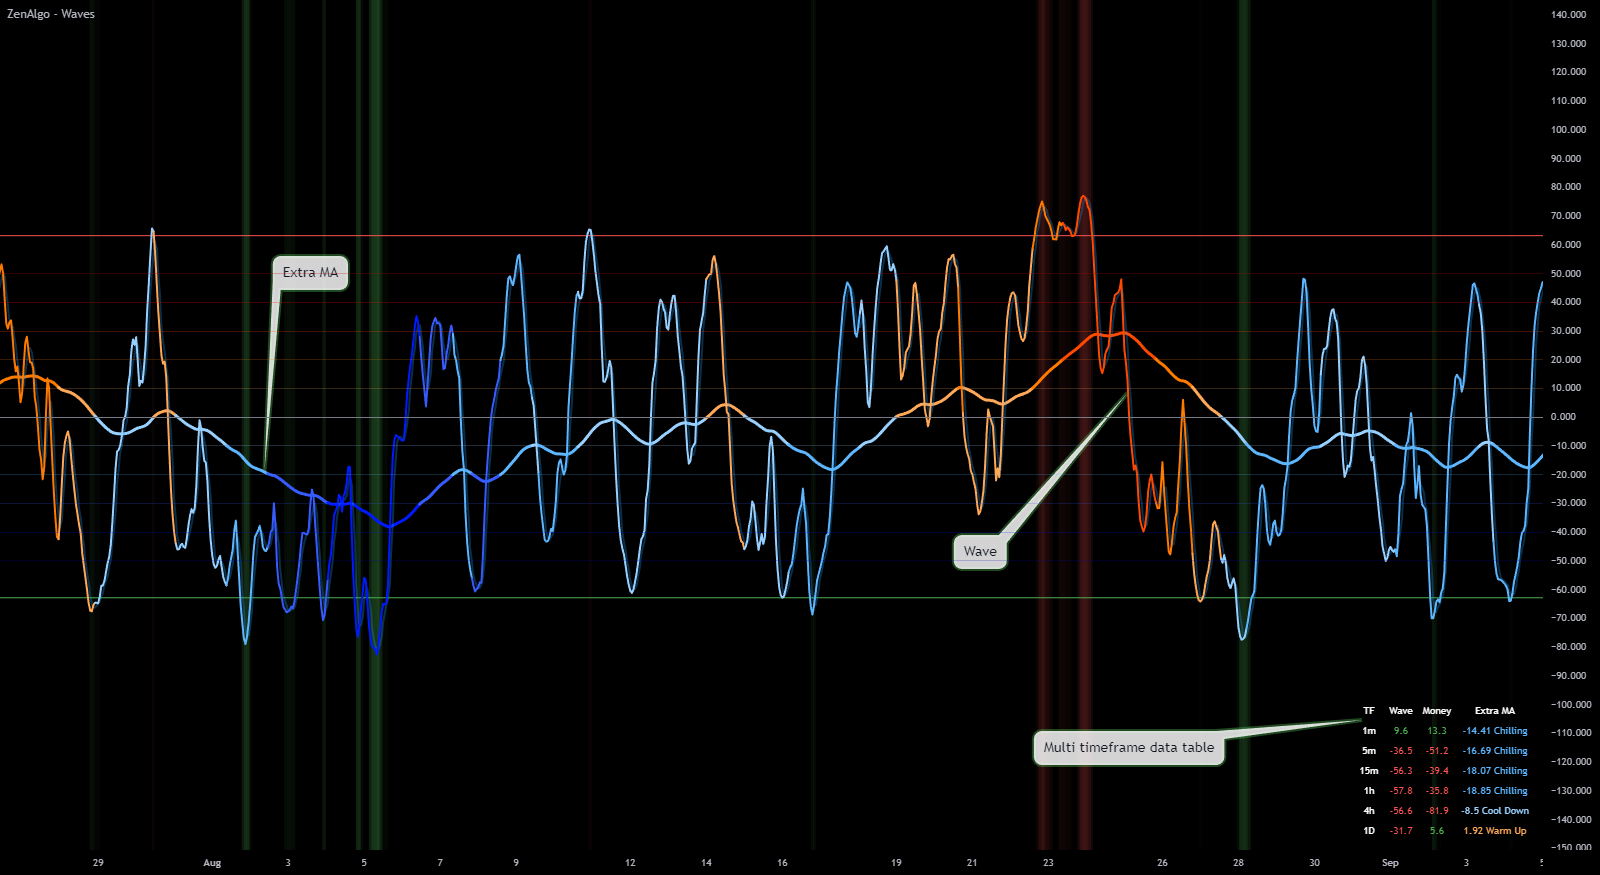
How to Use the Extra Moving Average
- Identify Overall Trend: The color-coded MA helps you quickly see if the trend is bullish or bearish across multiple timeframes.
- Compare Direction: Use the extra MA to see whether its broader direction agrees with a Wave and Signal crossover.
- Monitor Trend Changes Across Timeframes: The multi-timeframe table lets you view how the trend varies across different timeframes, helping you align your trades with the dominant trend.
The Extra MA is especially helpful in identifying trend reversals. For example, a sudden color change in higher timeframes may signal a shift in the overall market direction.
2. Background Color Coding for Overbought/Oversold Regions
The Waves indicator uses green and red background colors to highlight overbought and oversold zones dynamically based on Wave intensity relative to OBL (Overbought Level) and OSL (Oversold Level). This visual tool helps you easily spot extreme market conditions and aids in making entry or exit decisions.
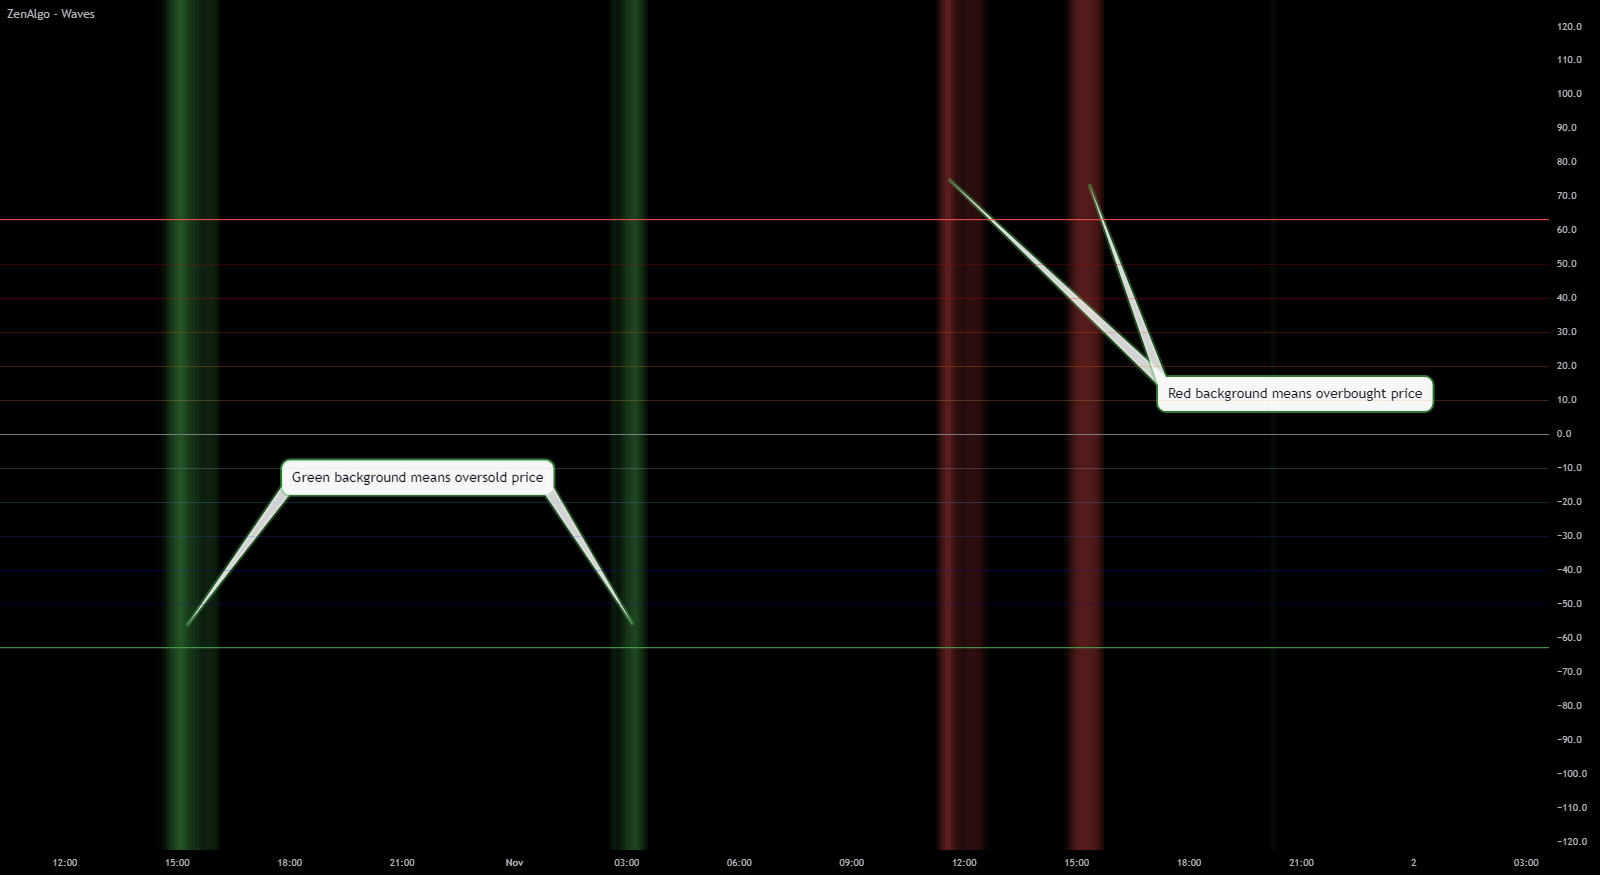
How to Use Background Color Coding
- Identify Reversal Zones: Green backgrounds indicate oversold conditions, suggesting buying opportunities, while red backgrounds indicate overbought conditions, signaling potential selling points.
- Avoid Overextended Markets: Use background colors to avoid entering trades in overbought (red) or oversold (green) conditions, which may be due for a reversal.
- Combine with Other Indicators: Pair background color signals with Wave and Signal crossovers to improve accuracy.
Background colors provide a quick reference during volatile periods. For example, a bullish Wave crossover inside a bullish background has more agreement than a crossover against it.
3. MoneyFlow Indicator
The MoneyFlow Indicator tracks the inflow and outflow of money, showing the strength behind price moves. Rising MoneyFlow indicates buying interest, while falling MoneyFlow signals selling pressure. When combined with Wave and Signal, MoneyFlow provides added confirmation for trade entries and exits.

How to Use MoneyFlow
- Confirm Trend Strength: If both MoneyFlow and Wave are aligned in the same direction (up or down), it strengthens the signal.
- Identify Divergences: Look for divergences between price and MoneyFlow to spot potential reversals.
- Gauge Buying/Selling Pressure: Rising MoneyFlow during a bullish Wave crossover indicates strong buying pressure, while falling MoneyFlow during a bearish crossover suggests selling pressure.
MoneyFlow divergences are useful for early trend reversal signals. For example, if price is rising but MoneyFlow is falling, it may indicate that the uptrend is weakening.
4. Multi-Timeframe Data Table
The Multi-Timeframe Data Table displays values across different timeframes for indicators such as Wave, WT, MoneyFlow, and Extra MA. You can customize the table's size, position, and text to match your preferences, providing a quick reference to trend direction across multiple timeframes.

How to Use the Multi-Timeframe Data Table
- Monitor Multi-Timeframe Trends: Check whether Wave, MoneyFlow, and Extra MA point in similar directions across timeframes.
- Customize Display: Adjust the table's size and positioning for quick access and to avoid clutter on your chart.
- Use for Trend Confirmation: When indicators align in the same direction across multiple timeframes, it signals stronger trend continuity.
Use the Multi-Timeframe Data Table as your "dashboard" for trend confirmation across timeframes, especially if you're trading with a longer outlook.
5. Overbought and Oversold Levels (OBL and OSL)
The Overbought Level (OBL) and Oversold Level (OSL) are plotted on the chart to help identify potential reversal zones. When the price reaches OBL or OSL, it's often at a point where the trend may be about to change.
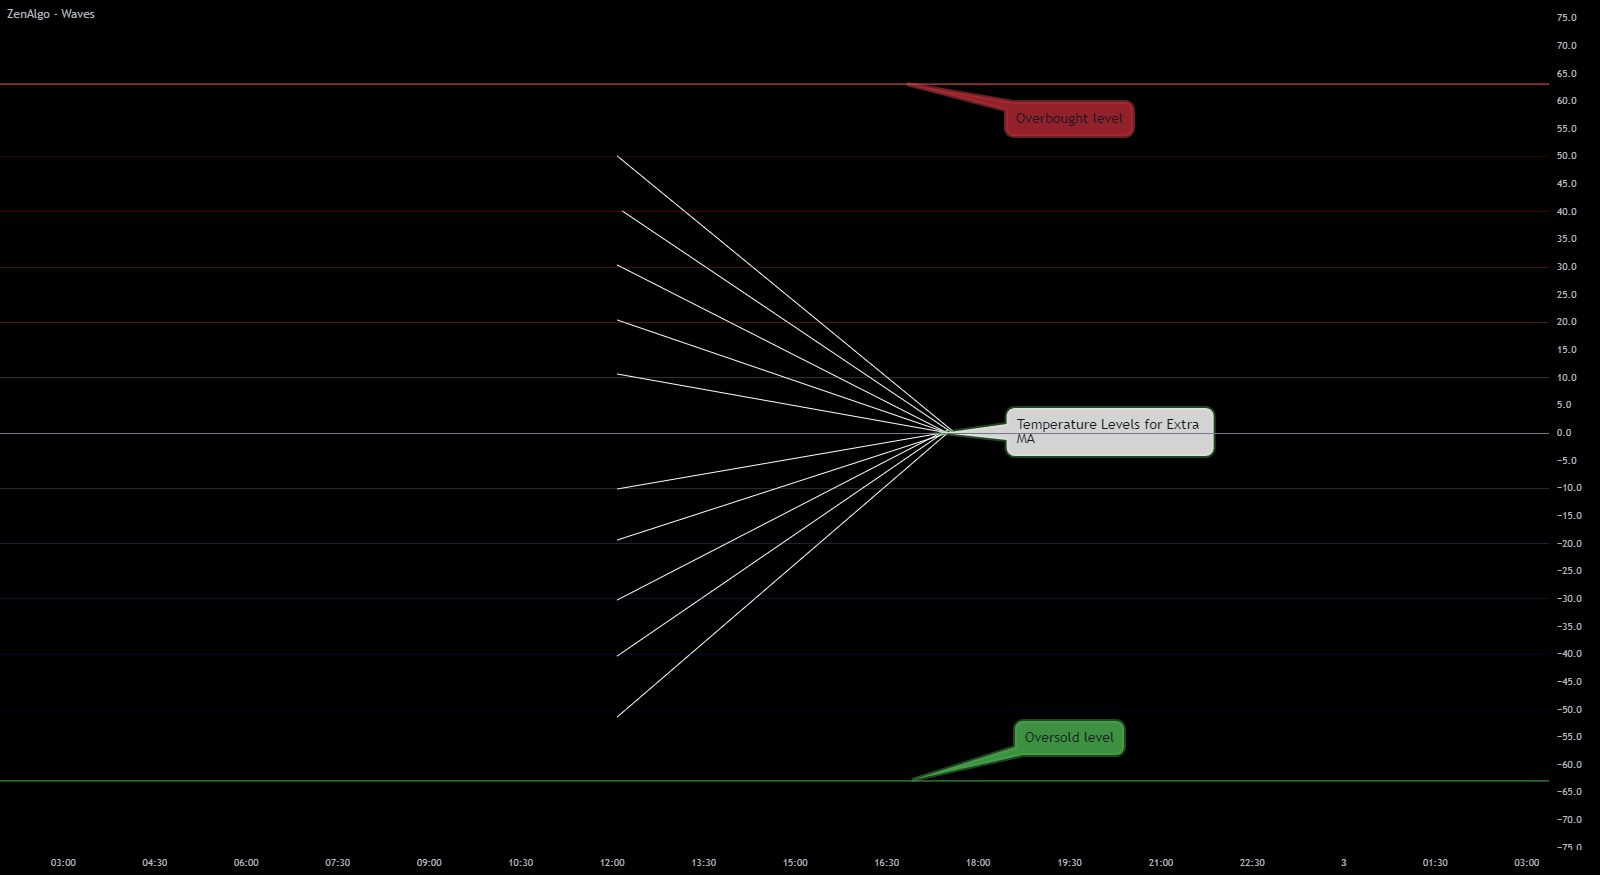
How to Use OBL and OSL Levels
- Spot Reversal Points: The OBL and OSL levels act as warning zones where price reversals are more likely.
- Be cautious at OBL: Reaching OBL means momentum is stretched upward; it does not guarantee a reversal.
- Inspect OSL carefully: OSL means momentum is stretched downward; wait for evidence that the decline is stabilizing.
A cross at OSL or OBL combines an extreme reading with a change in momentum. Price structure should still confirm the idea.
Summary of Other Indicators
- Extra Moving Average (MA): Assesses the broader trend and is color-coded across timeframes.
- Background Color Coding: Highlights overbought/oversold regions for easy identification of extreme conditions.
- MoneyFlow Indicator: Tracks money inflow and outflow, helping confirm price strength.
- Multi-Timeframe Data Table: Provides trend insights across multiple timeframes.
- Overbought/Oversold Levels (OBL and OSL): Identifies potential reversal zones.
Use these supporting components to explain the main oscillator. Keeping only the ones you actively read will make the panel easier to follow.