Waves - Signals
Waves uses several markers to make changes in momentum easier to notice. They include crossovers, overbought/oversold conditions, continuation markers, and opposite-direction signals. None of them should be read without the Wave, MoneyFlow, and price context around them.
Types of Signals in the Waves Indicator
- Bearish Signals
- Bullish Signals
- Crossover Signals (Diamonds)
- Overbought/Oversold Signals
- Contra Signals
- Strong Contra Signals (X Markers)
The sections below explain what each marker adds to the panel and how the stronger and weaker versions differ.
1. Bearish Signals
Bearish signals alert traders to potential selling opportunities, usually indicating that price momentum is turning downward. These signals are visually represented by downward triangles or red labels and often occur when conditions like a Wave crossing below the Signal line or MoneyFlow bearish divergence are detected.
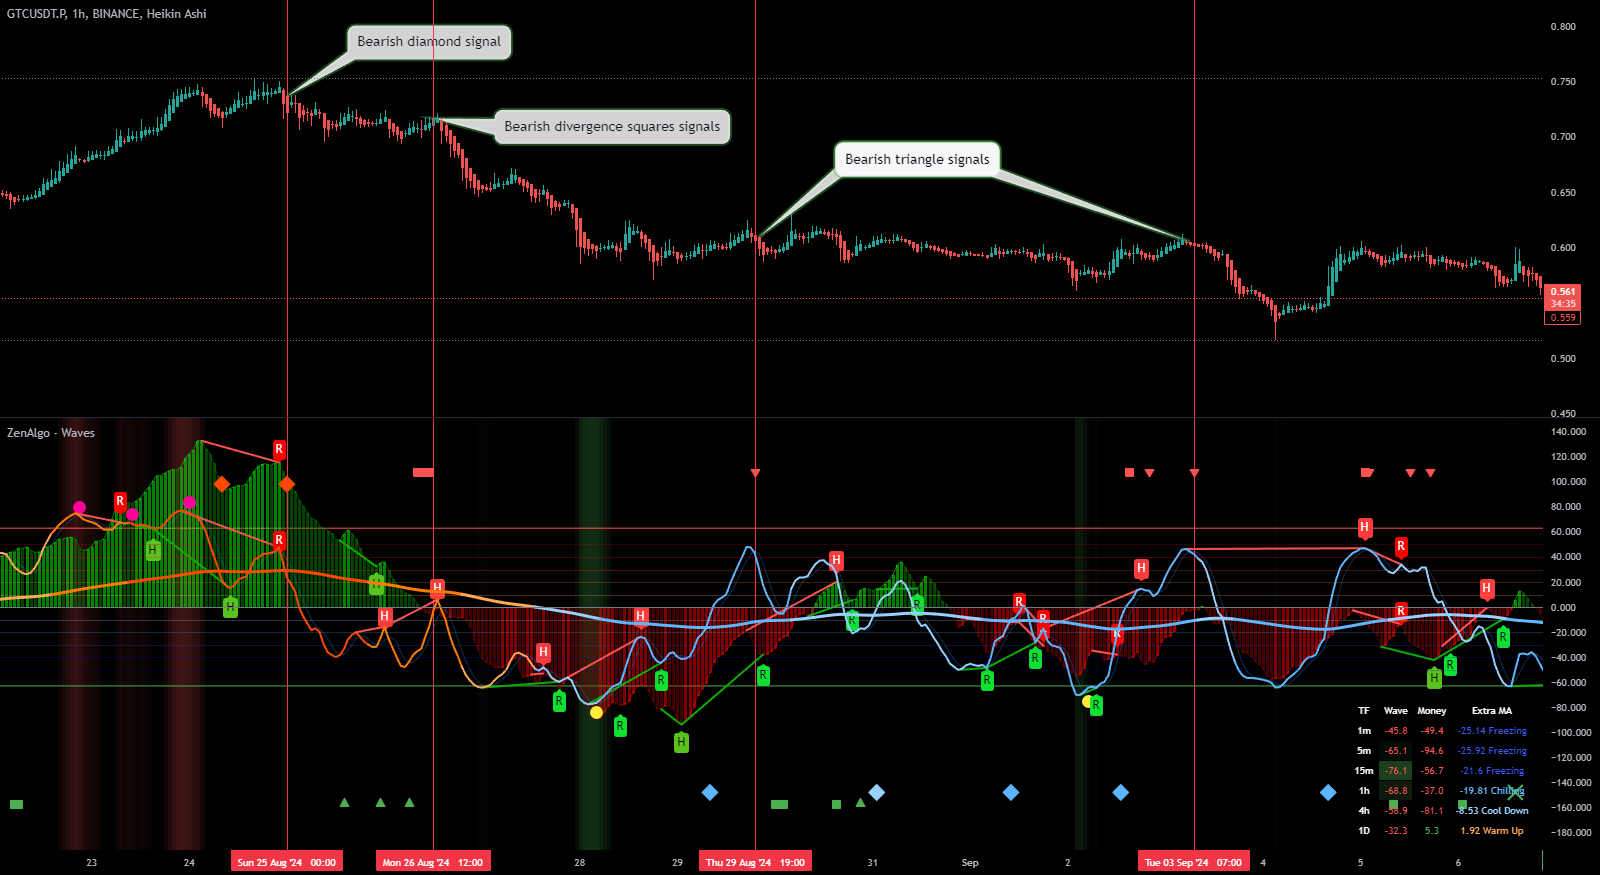
How to Use Bearish Signals
- Exit Long Positions: Bearish signals can indicate a potential downtrend, making it a good time to close long positions.
- Enter Short Positions: These signals suggest possible short-selling opportunities.
- Look for Confirmation: Confirm bearish signals with other indicators or trend analysis to strengthen your decision.
Bearish signals are most effective when they align with key resistance levels, increasing the likelihood of a successful short trade.
2. Bullish Signals
Bullish signals highlight potential buying opportunities and suggest upward momentum in the price action. These signals include upward triangles, green labels, and other markers that appear when conditions like a Wave crossing above the Signal line or MoneyFlow bullish divergence are present.

How to Use Bullish Signals
- Enter Long Positions: Bullish signals are generally considered good entry points for long positions.
- Monitor for Reversals: Bullish signals appearing after a downtrend may indicate the start of a reversal.
- Confirm with Additional Indicators: Use support levels, trend analysis, or other momentum indicators to confirm bullish signals.
Combine bullish signals with oversold levels to increase the probability of a successful trade entry, as these often represent discounted price levels.
3. Crossover Signals (Diamonds)
Diamond markers are used to indicate crossover events between the Wave line and an additional Moving Average (MA). These crossovers are essential for identifying trend shifts, with color-coded diamonds for bullish (uptrend) and bearish (downtrend) crosses.
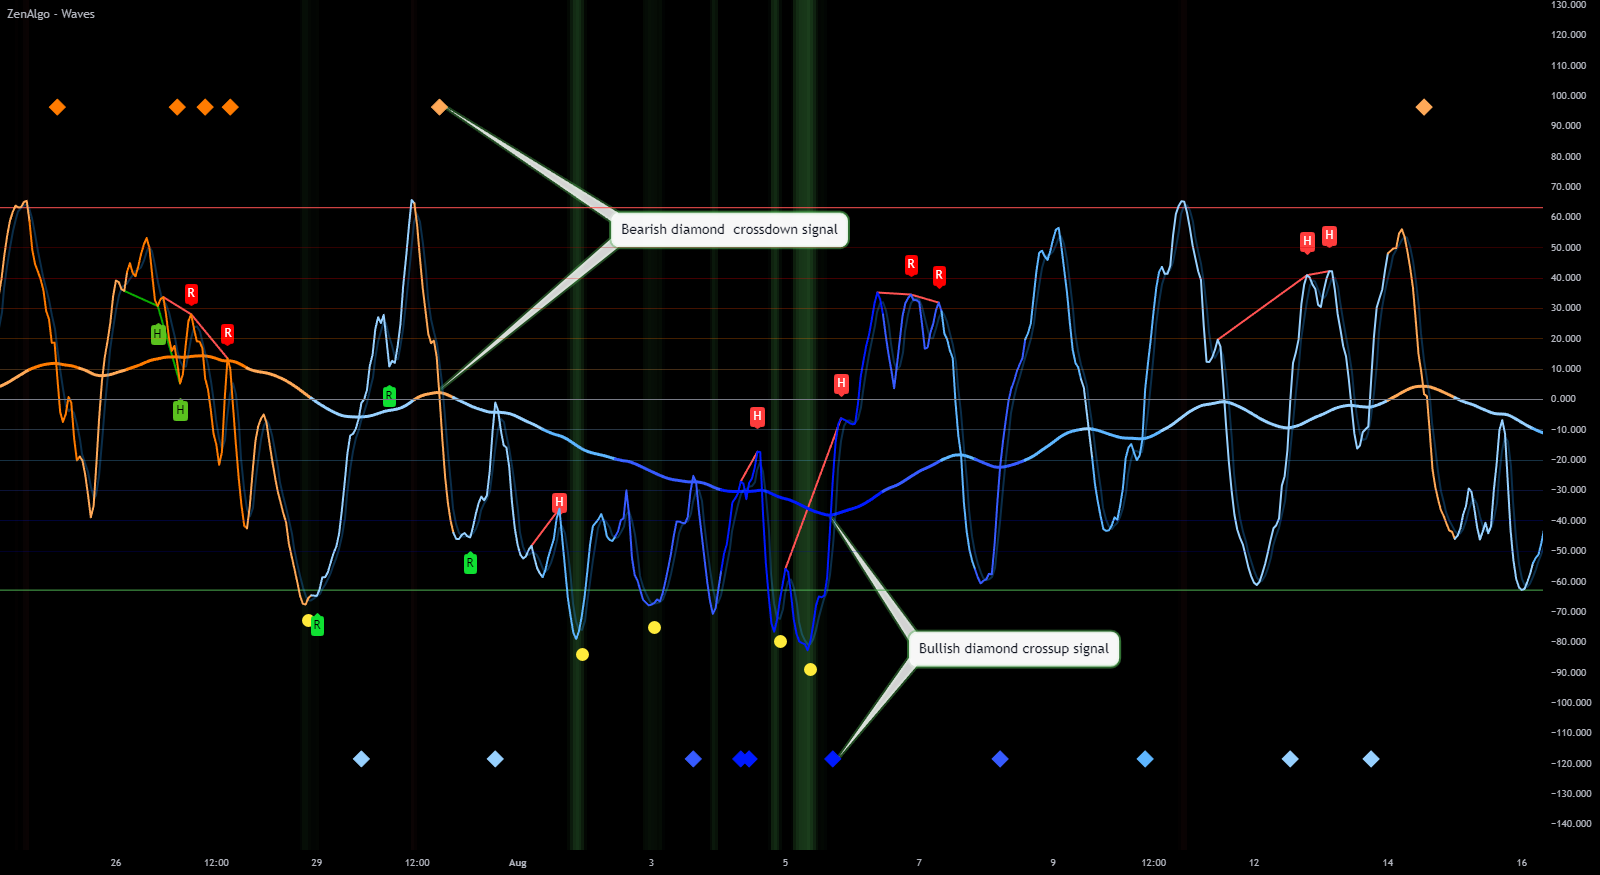
How to Use Crossover Signals
- Enter on Crosses: A bullish diamond suggests a buy opportunity, while a bearish diamond signals a sell opportunity.
- Confirm with Market Conditions: Use crossover signals in conjunction with broader market trends for a stronger entry or exit point.
- Monitor Subsequent Movement: Watch the price action following a crossover for potential follow-through.
Crossover signals work well in trending markets but may produce mixed results in sideways markets. Use trend analysis to determine optimal conditions.
4. Overbought/Oversold Signals
Overbought and oversold signals provide insights into potential reversal zones by marking when the market may be reaching exhaustion points. Green markers represent oversold levels (buying opportunities), while red markers indicate overbought levels (potential selling points).
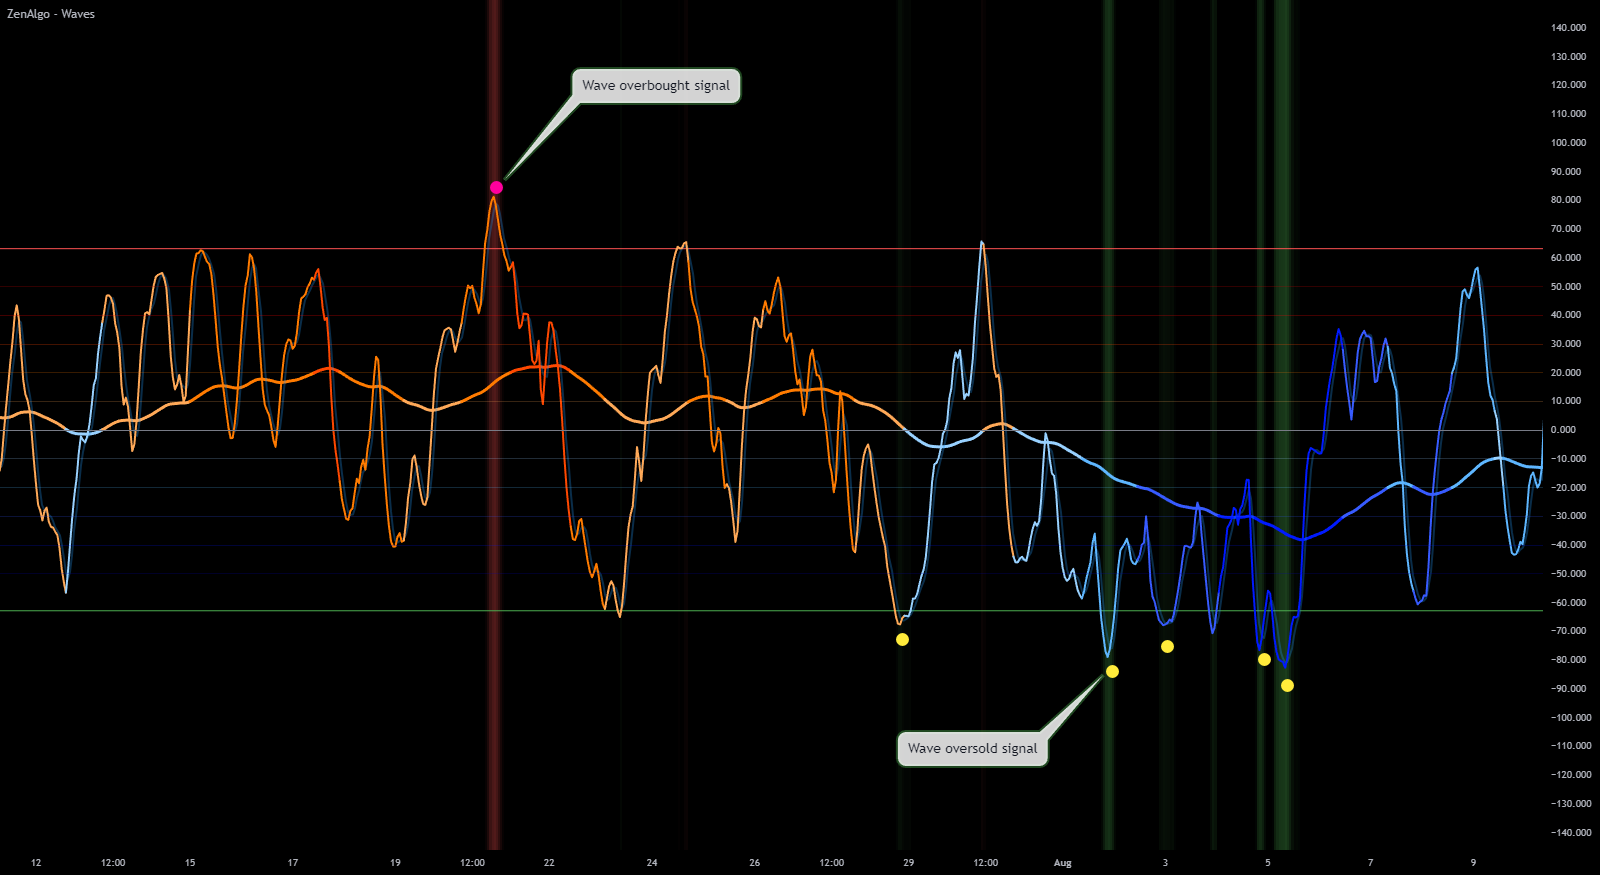
How to Use Overbought/Oversold Signals
- Identify Reversals: Look for price reversals when these signals appear, as they often mark exhaustion zones.
- Avoid Overextended Moves: Entering at overbought levels may expose trades to reversal risks.
- Use as Entry Points: Enter at oversold levels for a higher likelihood of a positive price move.
Combine overbought/oversold signals with trend indicators to avoid false entries in extended trends. These signals work best when price action aligns with existing support or resistance.
5. Contra Signals (Triangles)
Contra signals are moments when the Wave and Signal lines cross in a direction opposite to the prevailing trend. Green triangles indicate bullish contrarian signals, while red triangles signify bearish contrarian signals.
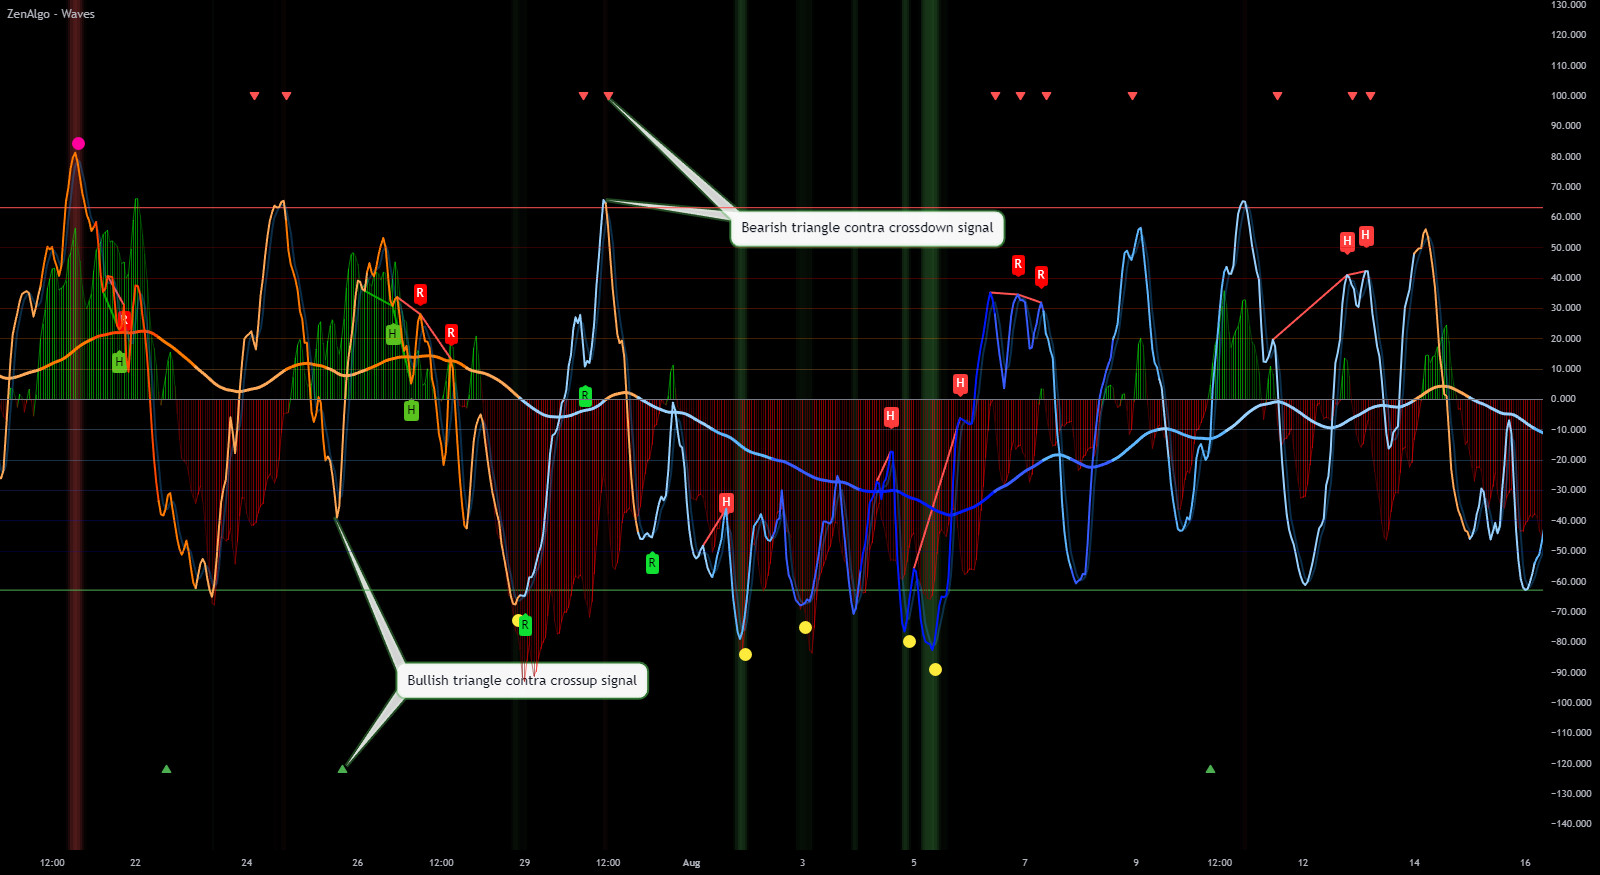
How to Use Contra Signals
- Spot Potential Reversals: Contra signals are effective in spotting potential reversals when the trend is reaching an extreme.
- Countertrend Trades: Use these signals to enter trades in the opposite direction of the trend if market conditions support a reversal.
- Proceed with Caution: Contra signals indicate possible trend shifts but may require confirmation from other indicators.
Contra signals are riskier than standard signals since they go against the prevailing trend. Only use them when strong confirmation is present.
6. Strong Contra Signals (X Markers)
Strong Contra Signals are represented by X markers. They use the opposite-cross condition plus the EMA filter. A green X is the bullish version and a red X is the bearish version.
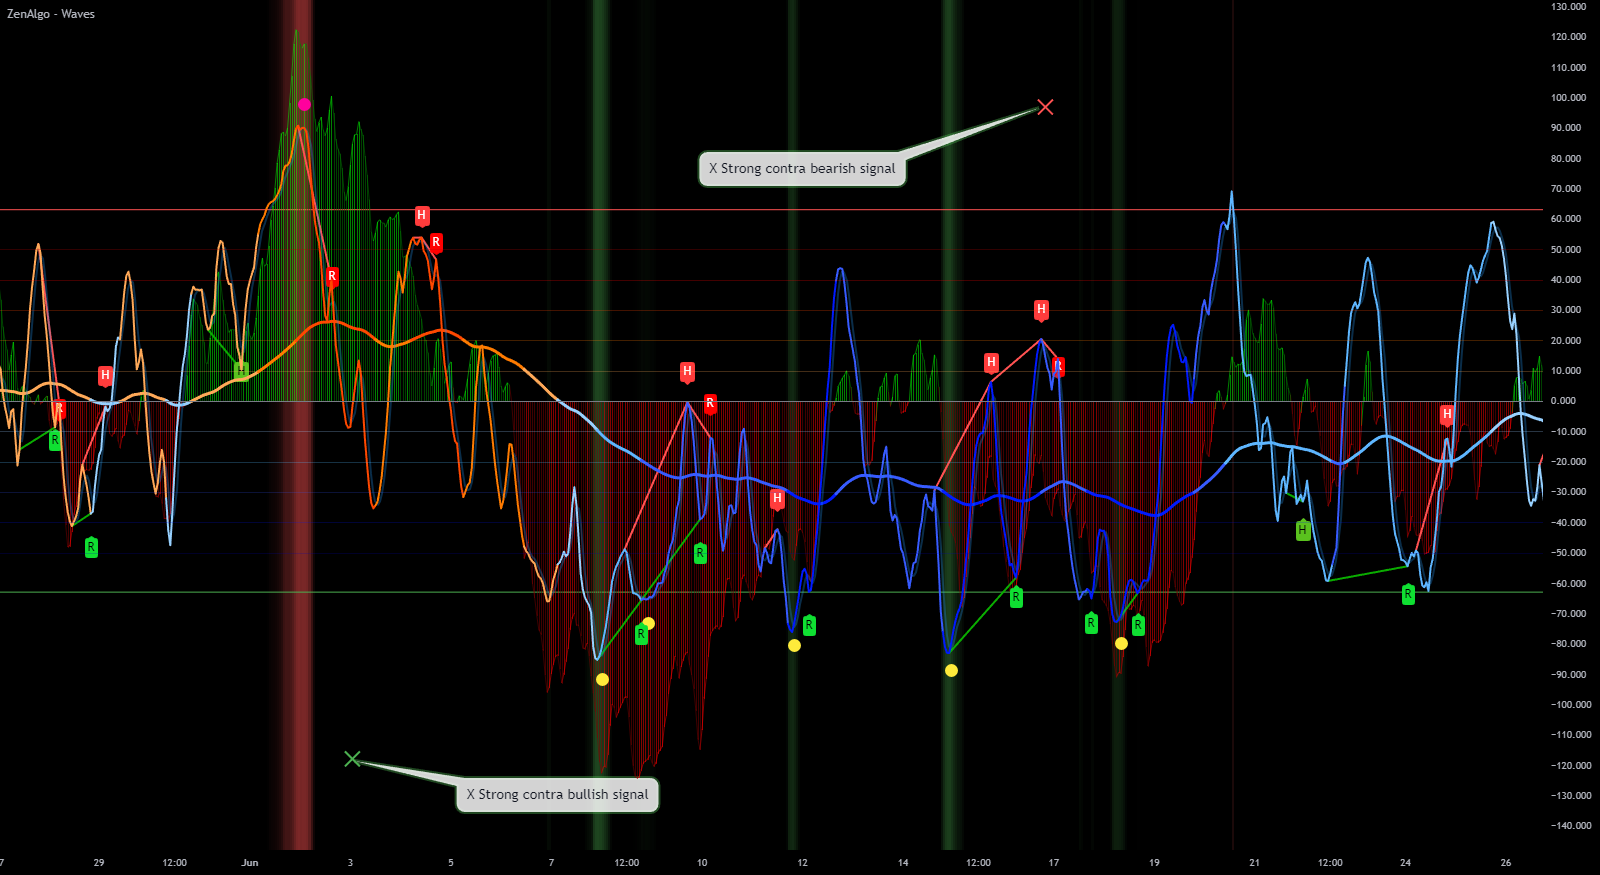
How to Use Strong Contra Signals
- Inspect Possible Reversals: Use X markers to find opposite crosses that also agree with the EMA filter.
- Wait for Alignment: These signals are strongest when combined with other indicators or levels, like support/resistance.
- Check Follow-Through: Confirm the condition with market context and the candles that follow.
An X is more selective than the corresponding triangle, but it still needs a useful price location and follow-through.
Summary of Signal Types
- Bearish Signals: Mark weakening or bearish momentum conditions.
- Bullish Signals: Mark improving or bullish momentum conditions.
- Crossover Signals (Diamonds): Help identify trend shifts via Wave and MA crossovers.
- Overbought/Oversold Signals: Indicate market exhaustion zones, useful for reversal trades.
- Contra Signals (Triangles): Spot contrarian opportunities against the prevailing trend.
- Strong Contra Signals (X Markers): Opposite crosses that also pass the EMA filter.
Use the markers to organize what you see in the oscillator. Price structure and the behavior after the marker determine whether the condition becomes tradable.