Maximum Drawdown Explained
Drawdown measures the decline from a previous equity peak to a later low. Maximum drawdown is the largest such decline in the measured period.
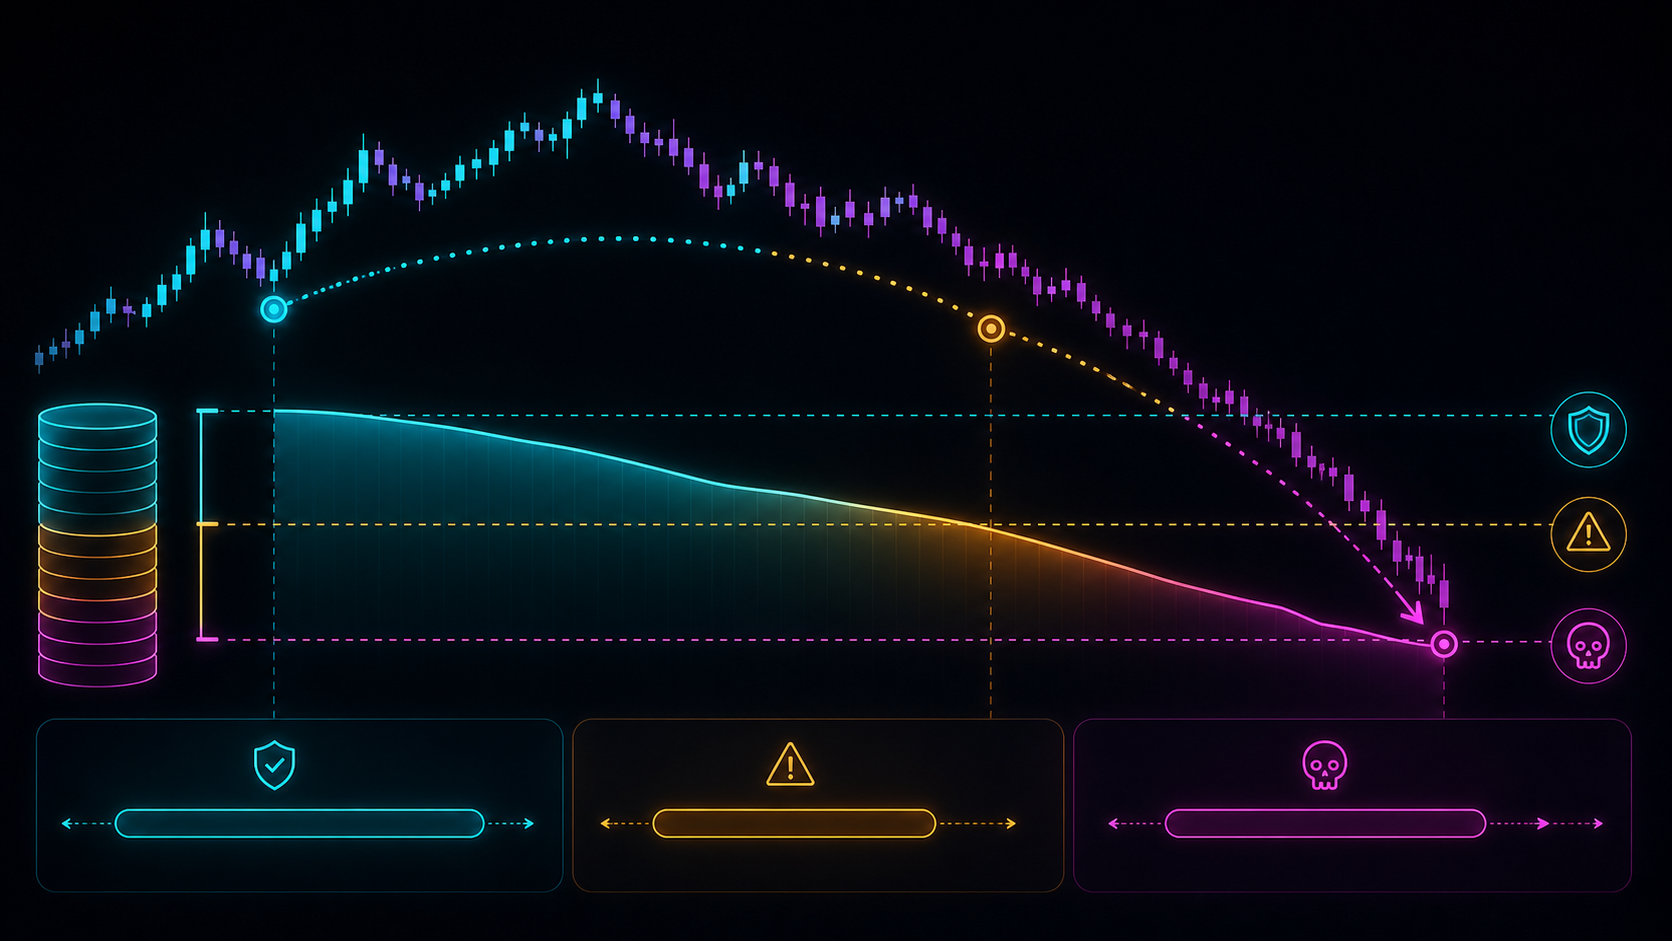
Maximum drawdown shows the worst peak-to-trough decline observed in a sample. It helps estimate strategy risk and emotional difficulty, but future drawdowns can always be larger.
How Drawdown Is Measured
If an account reaches $10,000 and later falls to $8,000 before making a new high, the drawdown is:
($10,000 - $8,000) ÷ $10,000 = 20%
Drawdown continues until equity makes a new peak.
Track both:
- closed-equity drawdown;
- mark-to-market drawdown including open positions.
Open losses still affect real risk.
Recovery Requires a Larger Percentage Gain
Loss and recovery percentages are asymmetric.
| Drawdown | Gain required to recover |
|---|---|
10% | approximately 11.1% |
20% | 25% |
50% | 100% |
This is why preventing deep drawdowns matters more than chasing rapid recovery.
What Creates Drawdown?
- normal strategy variance;
- changing market conditions;
- excessive risk per trade;
- correlated positions;
- execution costs;
- rule violations;
- strategy edge deterioration;
- exceptional market events.
The response depends on the cause.
Historical Maximum Is Not a Limit
A backtest's maximum drawdown is only the worst decline observed in that sample.
Future drawdown may be larger because:
- the sample missed certain conditions;
- execution differs from assumptions;
- the strategy changes;
- markets change;
- losses cluster differently.
Build a safety margin rather than sizing directly to the historical maximum.
Set Drawdown Response Rules
A documented plan may define:
- when risk per trade is reduced;
- when new positions stop;
- when execution quality is reviewed;
- when the strategy is revalidated;
- what evidence permits normal risk to resume.
Reducing risk should follow rules, not panic.
Drawdown Is Financial and Emotional
A mathematically survivable drawdown can still be too stressful to execute.
If drawdown causes:
- skipped valid setups;
- revenge trading;
- arbitrary strategy changes;
- increased risk to recover;
- inability to sleep or focus;
then actual risk is too high for the trader.
Key Takeaways
- Drawdown measures decline from an equity peak.
- Recovery percentages increase rapidly as drawdown deepens.
- Future drawdown can exceed historical maximum.
- Diagnose whether drawdown comes from variance, execution, or edge failure.
- Define risk-reduction and review rules in advance.
Continue Learning
- Prepare for losing streaks.
- Understand risk of ruin.
- Review risk per trade.
Historical drawdown does not cap future losses. Strategies can fail or experience materially worse conditions.