How to Set Up TradingView for Technical Analysis
A good charting workspace helps you make decisions. A poor one constantly asks for your attention.
The goal is not to display everything TradingView can show. The goal is to build a clean workspace where each element answers a specific question.
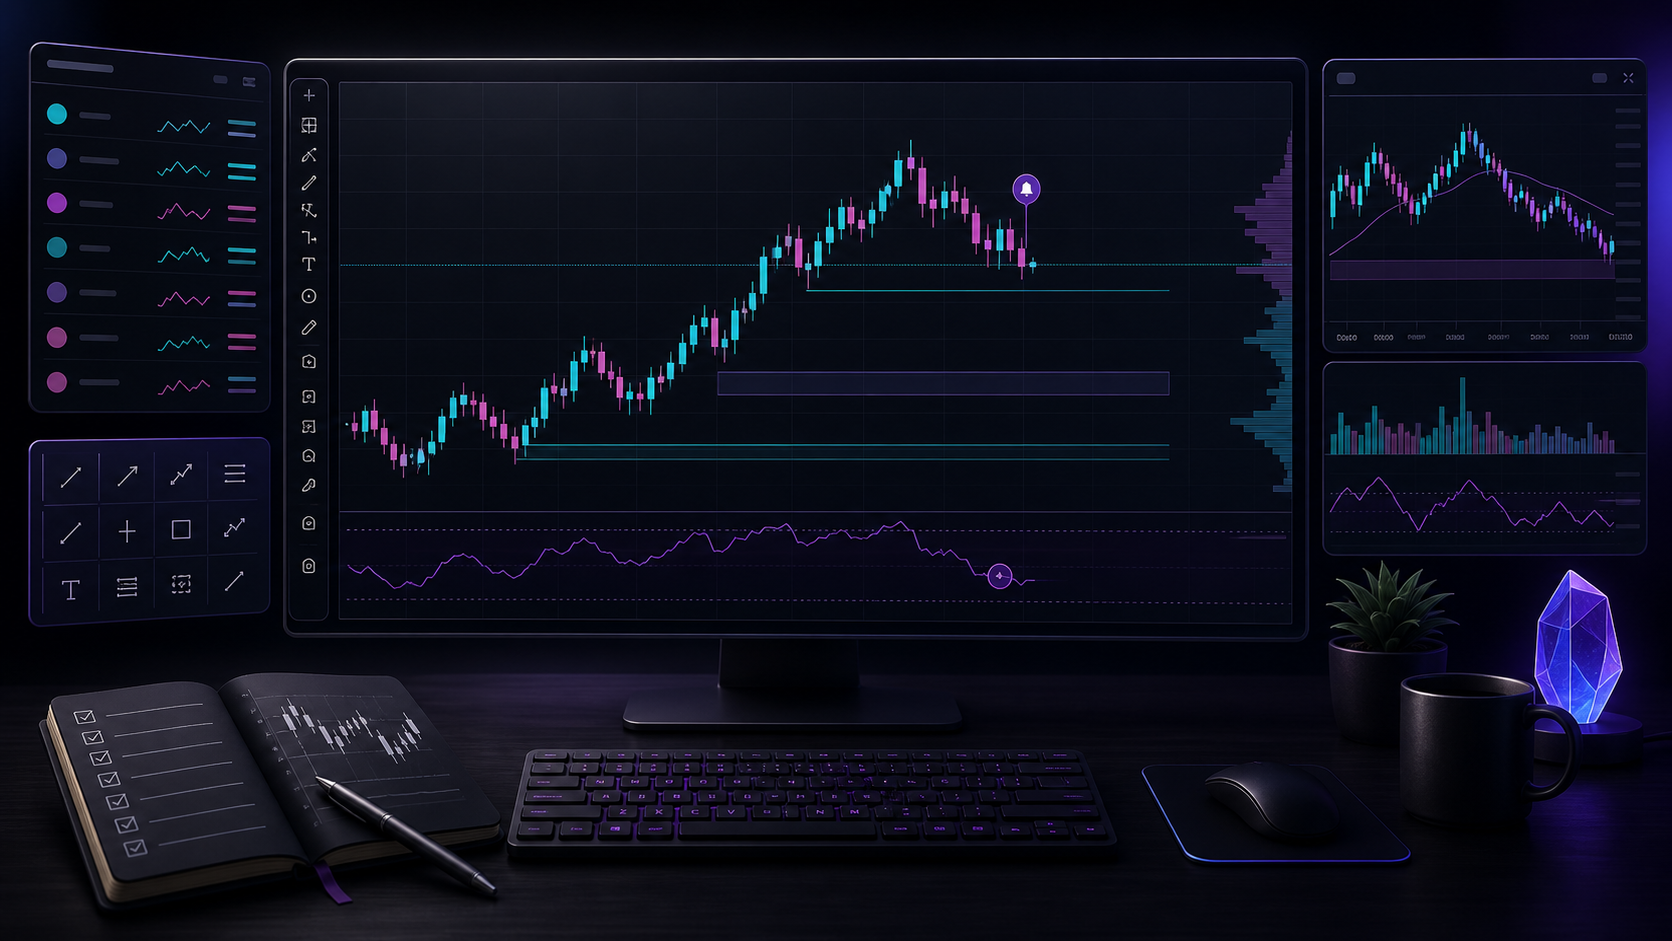
Start with one clean chart, a small watchlist, consistent timeframes, a saved layout, and only the indicators your process needs. Add alerts and a journal before adding more tools.
Start With the Correct Symbol
Before analyzing, confirm:
- the asset and quote currency;
- the exchange or broker;
- spot, futures, perpetual, or another product;
- session and timezone;
- whether volume and other data are available.
Several charts may share a familiar ticker while representing different instruments. Analyze the one that best matches what you plan to trade.
Choose a Simple Chart Type
Traditional candlesticks show the actual open, high, low, and close of each period. They are the safest default for precise price analysis.
Heikin Ashi candles use calculated values to smooth visual noise and make trends easier to see. They are useful for context, but their displayed prices are not exact tradable prices.
Read Heikin Ashi Candles Explained before using them for entries or exits.
Build a Timeframe Ladder
Use a small, consistent set of timeframes.
| Purpose | Example relationship |
|---|---|
| Context | Higher timeframe |
| Setup | Main working timeframe |
| Execution | Lower timeframe, only if needed |
For example, a trader may use the daily chart for broad context, the four-hour chart for setup structure, and the one-hour chart for execution. The exact timeframes matter less than giving each one a clear purpose.
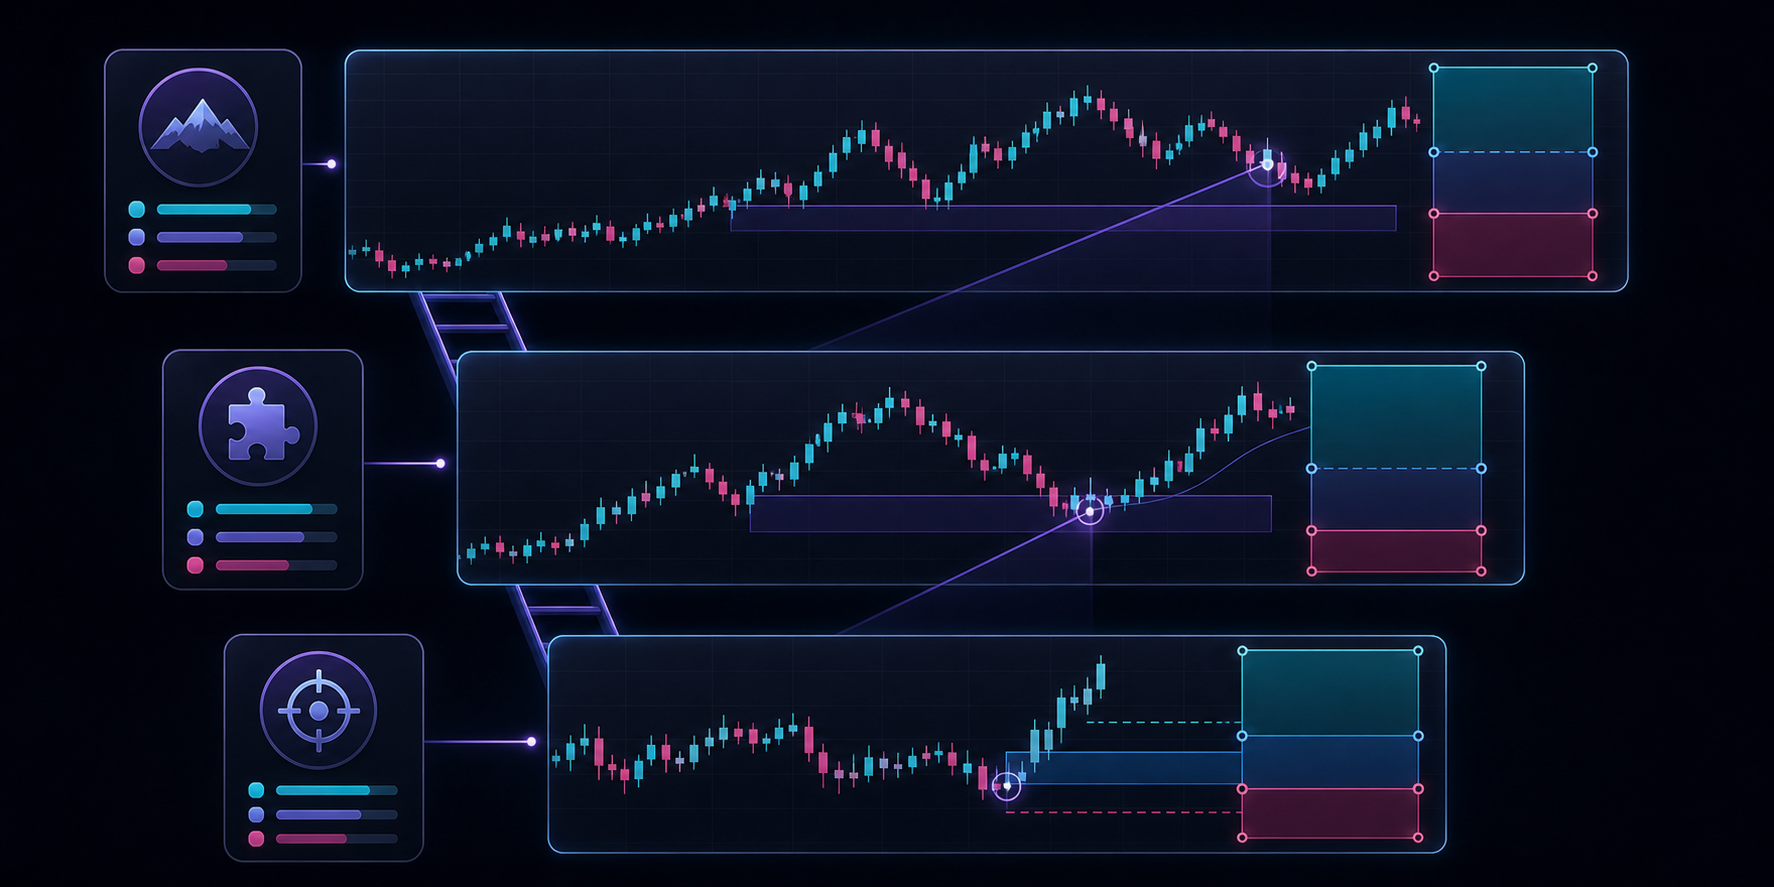
Too many timeframes create conflicting stories.
Create a Focused Watchlist
Your watchlist should contain instruments you are prepared to trade or monitor.
Organize it by purpose:
- broad market references;
- primary tradable instruments;
- secondary opportunities;
- related markets used for context.
Use a consistent naming or color system. Remove instruments you do not understand or cannot realistically trade.
Keep the Chart Clean
Start with price and a few objective areas.
Then add tools one question at a time:
| Question | Possible tool |
|---|---|
| What is the trend? | Avenger or Haze |
| Where are meaningful areas? | Levels or Ranger |
| Is momentum changing? | Waves or Advanced RSI |
| Is participation supporting the move? | Delta, Ultimate, or Advanced Open Interest |
If two indicators answer the same question in nearly the same way, you may not need both.
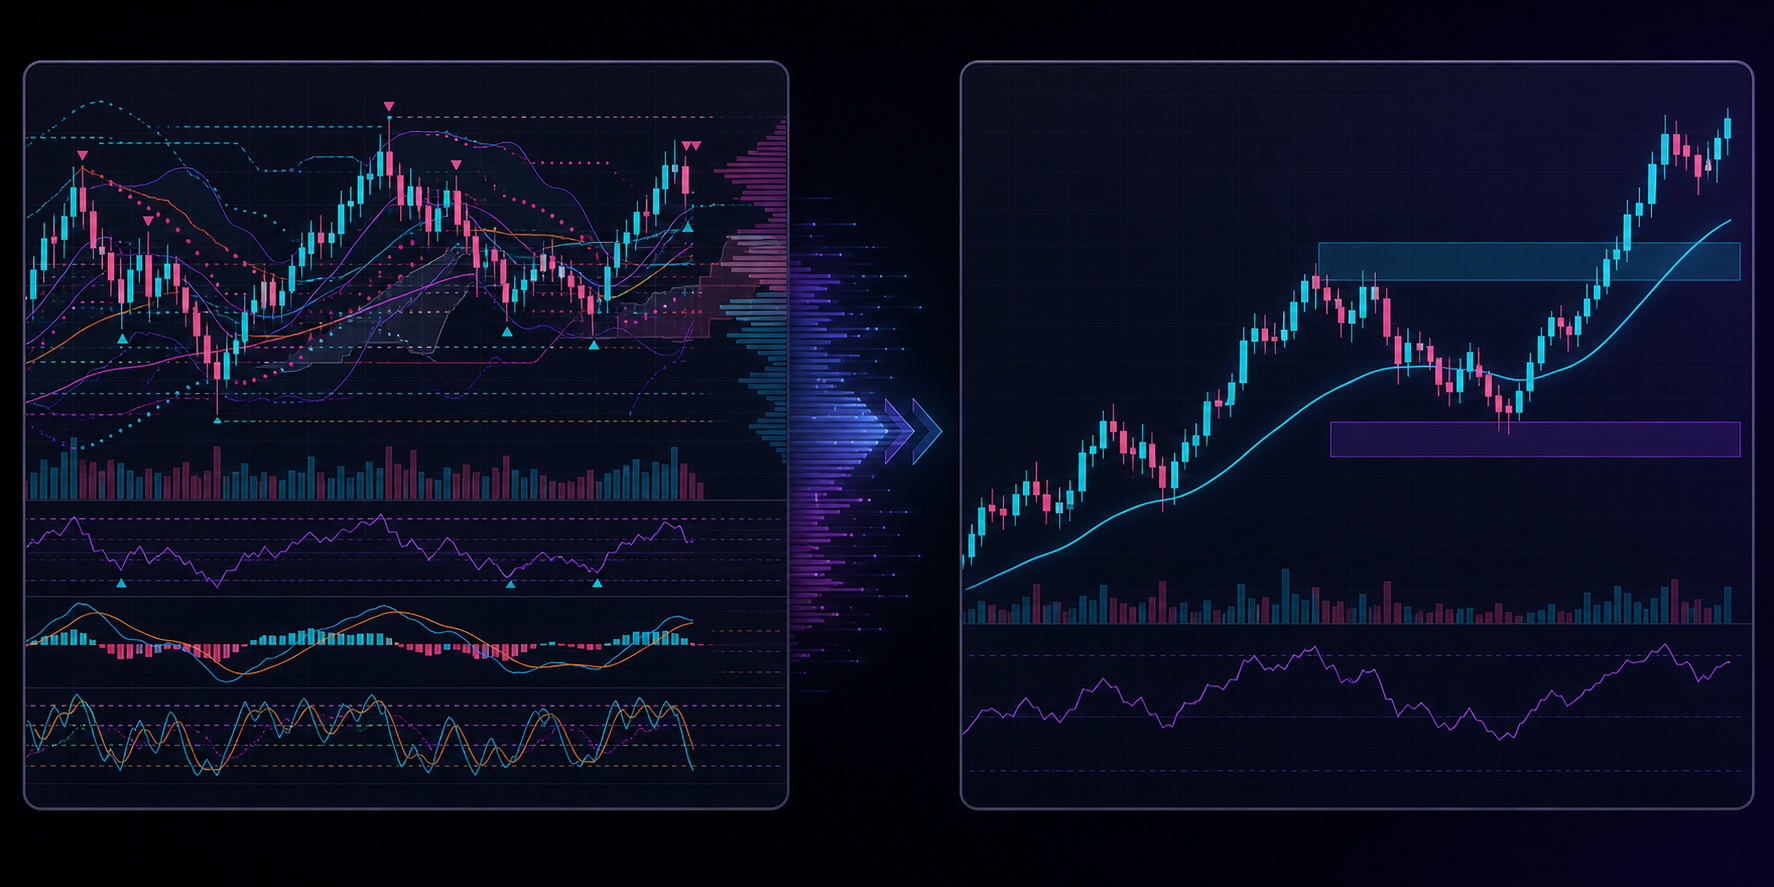
Create separate layouts or indicator templates for different workflows. A market overview, trend setup, and order-flow execution chart do not need every tool visible at the same time.
Use Drawings as Decisions, Not Decoration
Useful drawings include:
- important horizontal areas;
- a clearly defined range;
- an invalidation level;
- planned entry and target areas;
- a small note explaining the trade idea.
Delete old drawings that no longer affect a decision. A chart covered in historical lines makes current structure harder to read.
Set Alerts Before Watching the Chart
Alerts reduce the temptation to stare at price and invent trades.
Create alerts near:
- planned areas of interest;
- important range boundaries;
- invalidation levels;
- conditions required by your setup.
An alert is a request to review the chart, not an automatic instruction to trade.
Save and Protect Your Workflow
Maintain:
- a saved layout;
- a clean default template;
- one screenshot before each planned trade;
- consistent colors;
- a short checklist outside or beside the chart.
TradingView offers chart layouts, alerts, screeners, drawing tools, indicators, paper trading, and other features. Availability and limits vary by plan, so confirm current details on the official TradingView website.
A Beginner ZenAlgo Layout
Start with a small stack:
- Use Avenger for trend context and areas of interest.
- Use Levels for objective reference levels.
- Keep traditional candles available for precise price checks.
- Add one confirmation tool only after you understand the setup.
- Save a clean screenshot before and after each simulated trade.
Do not add every ZenAlgo indicator during the first session. The tools are most useful when each has a defined role.
A Five-Minute Chart Hygiene Routine
Before analysis:
- confirm the symbol and data source;
- remove expired drawings;
- check the higher timeframe;
- review alerts and scheduled events;
- hide tools unrelated to today's setup;
- write the condition that would make you do nothing.
This small routine prevents a surprising amount of avoidable confusion.
Common Mistakes
Starting With Too Many Indicators
Complexity can hide the fact that no clear process exists.
Changing Colors and Settings Constantly
Consistency builds visual recognition. Change settings only for a reason you can test.
Using the Wrong Symbol
Similar ticker names can represent different exchanges, contracts, and data.
Treating Alerts as Signals
An alert means a condition occurred. You still need context, confirmation, and risk.
Ignoring Exact Price When Using Heikin Ashi
Always verify tradable prices with traditional candles or the execution platform.
Key Takeaways
- Build the workspace around decisions, not features.
- Confirm the exact symbol and data source.
- Give each timeframe and indicator one clear purpose.
- Use alerts to wait for planned conditions.
- Keep drawings and watchlists intentional.
- Save templates and screenshots to support review.
Continue Learning
- Compare TradingView and other charting platforms.
- Review essential trading terms.
- Learn how to choose a trading style.
- Follow the ZenAlgo product onboarding guide.
Practice With ZenAlgo
Use the trial to build one clean TradingView layout. Start with trend and levels, then add another tool only when it answers a question your current layout cannot.
Charting tools organize information but do not remove market risk. Always verify orders, prices, and risk on the platform where you execute.